Hi @Squirrel15 ,
How about this:
1. Create two custom column.
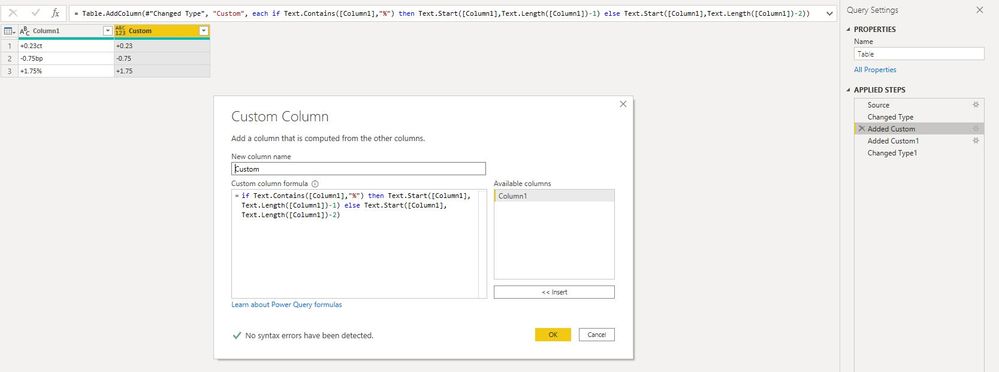
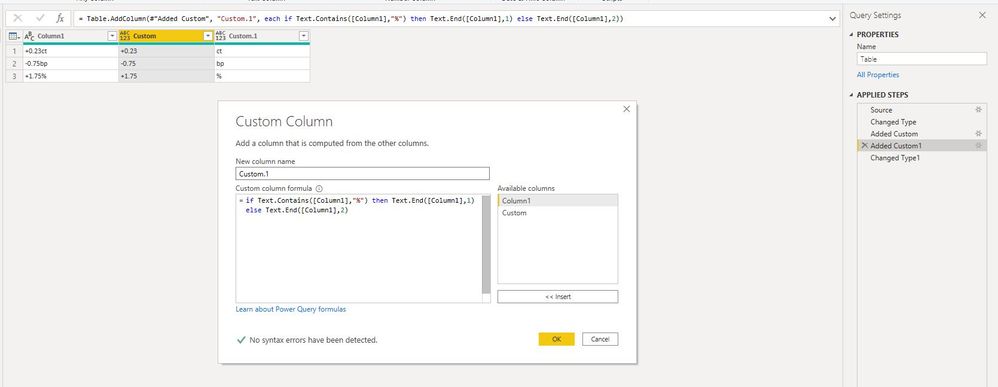
let
    Source = Table.FromRows(Json.Document(Binary.Decompress(Binary.FromText("i45W0jbQMzJOLlGK1YlW0jXQMzdNKgCztQ2BbFWl2FgA", BinaryEncoding.Base64), Compression.Deflate)), let _t = ((type nullable text) meta [Serialized.Text = true]) in type table [Column1 = _t]),
    #"Changed Type" = Table.TransformColumnTypes(Source,{{"Column1", type text}}),
    #"Added Custom" = Table.AddColumn(#"Changed Type", "Custom", each if Text.Contains([Column1],"%") then Text.Start([Column1],Text.Length([Column1])-1) else Text.Start([Column1],Text.Length([Column1])-2)),
    #"Added Custom1" = Table.AddColumn(#"Added Custom", "Custom.1", each if Text.Contains([Column1],"%") then Text.End([Column1],1) else Text.End([Column1],2)),
    #"Changed Type1" = Table.TransformColumnTypes(#"Added Custom1",{{"Custom", type number}, {"Custom.1", type text}})
in
    #"Changed Type1"
2. Put "Custom.1" column into "Category" field and "Custom" column into "Measure Deviation".
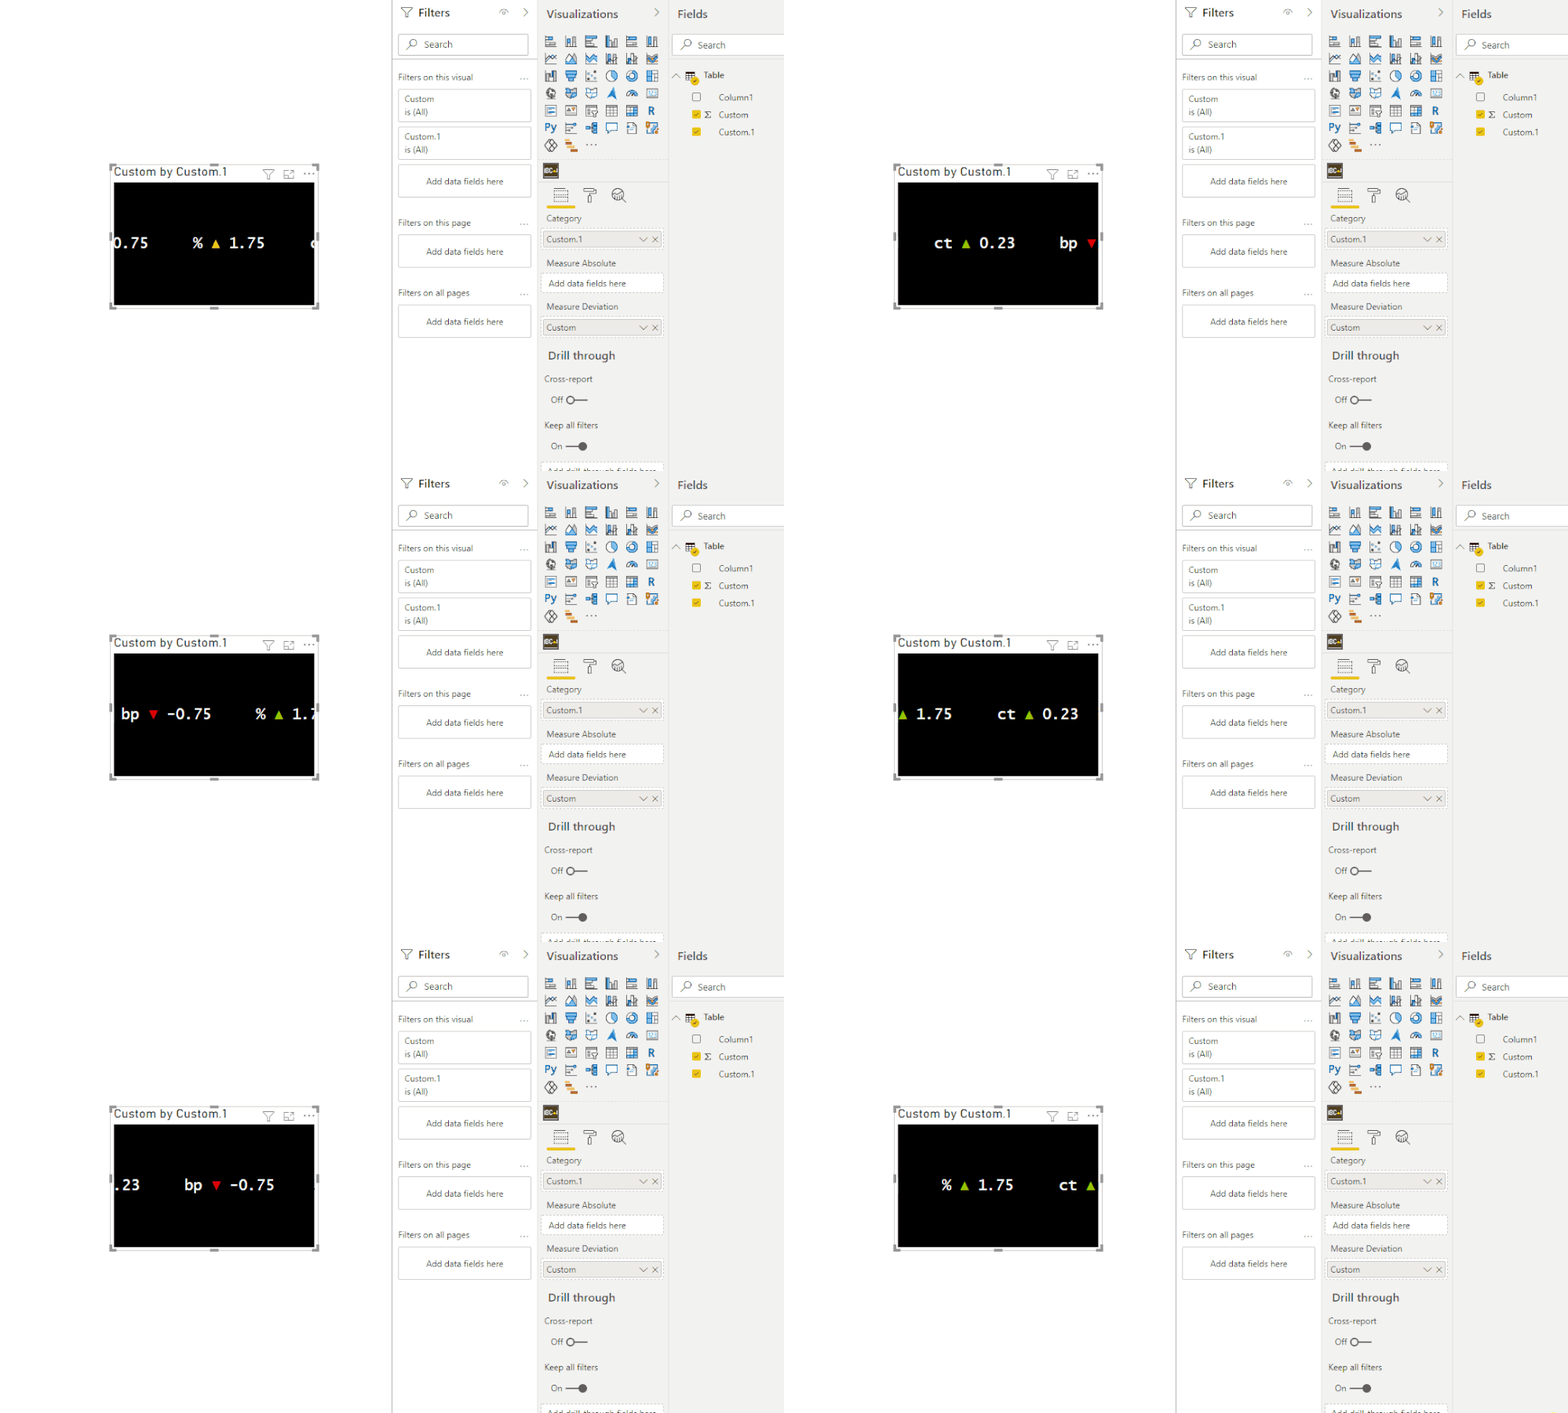
Best Regards,
Icey
If this post helps, then please consider Accept it as the solution to help the other members find it more quickly.


