Forum Discussion
Getting the sum of maximum distinct values
- 6 years ago
Hi, Anonymous
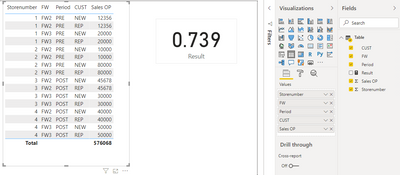
Based on your description, I created data to reproduce your scenario. The pbix file is attached in the end.
Table:
You may create a measure as below.
Result = var tab = GROUPBY( 'Table', 'Table'[Storenumber], 'Table'[FW], 'Table'[Period], "Max",MAXX(CURRENTGROUP(),'Table'[Sales OP]) ) return DIVIDE( SUMX( FILTER( tab, [Period]="PRE" ), [Max] ), SUMX( FILTER( tab, [Period]="POST" ), [Max] ) )Result:
Best Regards
Allan
If this post helps, then please consider Accept it as the solution to help the other members find it more quickly.
Please try this expression
Sum of Max Sales per Store per Week =
VAR __summarytable =
ADDCOLUMNS (
SUMMARIZE ( Table, Table[FW], Table[Storenumber] ),
"@maxsales", CALCULATE ( MAX ( Table[Sales OP] ) )
)
RETURN
SUMX ( __summarytable, [@maxsales] )
If this works for you, please mark it as the solution. Kudos are appreciated too. Please let me know if not.
Regards,
Pat
- Anonymous6 years agoNot applicable
Hi Pat,
Thanks for the reply.
Can it be done without creating another column? I want to divide that sum(maximum values for all stores) by another value and display that value as Card(123). In the sample data, I have provided only PRE Period but I have got Post Period also.
Regards
Prakash
- mahoneypat6 years ago
Microsoft Employee
The expression I provided is for a measure so no extra column needed. If you want to compare your PRE and POST, you could adapt the measure like this, for example:
PRE vs POST Max Sales per Store per Week = VAR __summarytable = ADDCOLUMNS ( SUMMARIZE ( Table, Table[FW], Table[Storenumber], Table[Period] ), "@maxsales", CALCULATE ( MAX ( Table[Sales OP] ) ) ) VAR __PRE = SUMX ( FILTER ( __summarytable, Table[Period] = "PRE" ), [@maxsales] ) VAR __POST = SUMX ( FILTER ( __summarytable, Table[Period] = "POST" ), [@maxsales] ) RETURN DIVIDE ( __PRE, __POST )If this works for you, please mark it as the solution. Kudos are appreciated too. Please let me know if not.
Regards,
Pat