Forum Discussion

rubanjbe's avatar
rubanjbe
Regular Visitor
6 years ago
Solved

Create visit number for each customer

Hi,

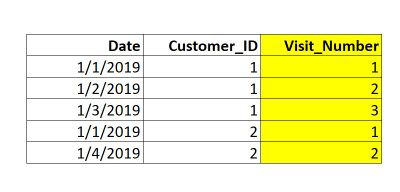
I would really appriciate anyone who could help me figure out a power query/dax to generate visit number for each customer.  I have all the dates a customer visited in ascending order. I now need to create the visit_number column as shown


Thanks,

Ruban

 
  • You can use a query to do this like (replace Table with your table):


    let
    Source = Table,
    #"Grouped Rows" = Table.Group(Source, {"Customer_Id"}, {{"Rows", each _, type table [Date=date, CustomerId=number]}}),
    Custom1 = Table.TransformColumns(#"Grouped Rows", {"Rows", each Table.AddIndexColumn(_, "Visit_Number", 1)}),
    #"Expanded Rows" = Table.ExpandTableColumn(Custom1, "Rows", {"Date", "Visit_Number"}, {"Date", "Visit_Number"})
    in
    #"Expanded Rows"

    P.S. this assumes the table is sorted by date. If not you will need to sort it that way first


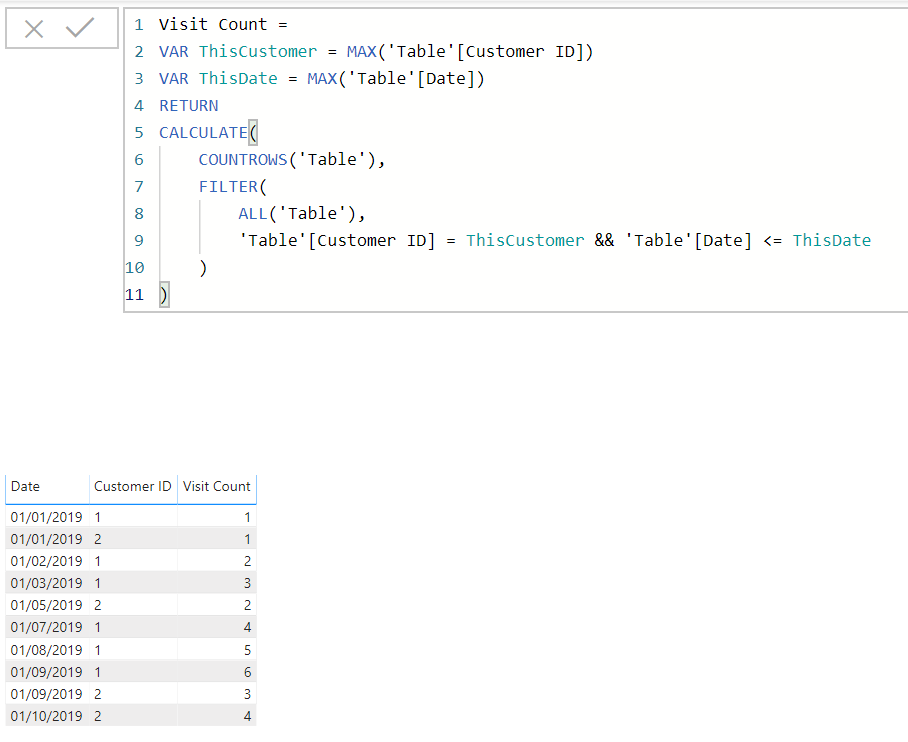
  • The following measure will do this in DAX if you want to do it that way. Just depends on where you need it. On a very large data set, the Power Query method will cause a longer refresh, but depending on your model, a DAX measure may be slower to the end user. Anything under a few hundred thousand records though I doubt anyone would know the difference.


    Unlike the PQ method though, this doesn't require anything to be sorted first.


    Visit Count = 
    VAR ThisCustomer = MAX('Table'[Customer ID])
    VAR ThisDate = MAX('Table'[Date])
    RETURN
    CALCULATE(
        COUNTROWS('Table'),
        FILTER(
            ALL('Table'),
            'Table'[Customer ID] = ThisCustomer && 'Table'[Date] <= ThisDate
        )
    )


    EDIT: This is slightly cleaner.


    Visit Count = 
    VAR ThisDate = MAX('Table'[Date])
    RETURN
    CALCULATE(
        COUNTROWS('Table'),
        FILTER(
            ALLEXCEPT('Table','Table'[Customer ID]),
            'Table'[Date] <= ThisDate
        )
    )


3 Replies

  • artemus's avatar
    artemus
    Icon for Microsoft Employee rankMicrosoft Employee

    You can use a query to do this like (replace Table with your table):


    let
    Source = Table,
    #"Grouped Rows" = Table.Group(Source, {"Customer_Id"}, {{"Rows", each _, type table [Date=date, CustomerId=number]}}),
    Custom1 = Table.TransformColumns(#"Grouped Rows", {"Rows", each Table.AddIndexColumn(_, "Visit_Number", 1)}),
    #"Expanded Rows" = Table.ExpandTableColumn(Custom1, "Rows", {"Date", "Visit_Number"}, {"Date", "Visit_Number"})
    in
    #"Expanded Rows"

    P.S. this assumes the table is sorted by date. If not you will need to sort it that way first


  • edhans's avatar
    edhans
    Icon for Community Champion rankCommunity Champion

    The following measure will do this in DAX if you want to do it that way. Just depends on where you need it. On a very large data set, the Power Query method will cause a longer refresh, but depending on your model, a DAX measure may be slower to the end user. Anything under a few hundred thousand records though I doubt anyone would know the difference.


    Unlike the PQ method though, this doesn't require anything to be sorted first.


    Visit Count = 
    VAR ThisCustomer = MAX('Table'[Customer ID])
    VAR ThisDate = MAX('Table'[Date])
    RETURN
    CALCULATE(
        COUNTROWS('Table'),
        FILTER(
            ALL('Table'),
            'Table'[Customer ID] = ThisCustomer && 'Table'[Date] <= ThisDate
        )
    )


    EDIT: This is slightly cleaner.


    Visit Count = 
    VAR ThisDate = MAX('Table'[Date])
    RETURN
    CALCULATE(
        COUNTROWS('Table'),
        FILTER(
            ALLEXCEPT('Table','Table'[Customer ID]),
            'Table'[Date] <= ThisDate
        )
    )


    • justinbouchard's avatar
      justinbouchard
      Frequent Visitor

      Hoping to jump in on this. I have a similiar situation where I want to count the number of times a client has visited the office in total.


      I used this to get the # of visits column:

      Visit Count = 
      VAR ThisDate = MAX('Table'[Date])
      RETURN
      CALCULATE(
          COUNTROWS('Table'),
          FILTER(
              ALLEXCEPT('Table','Table'[Customer ID]),
              'Table'[Date] <= ThisDate

       Then used this measure :

      3 visits = calculate(

          COUNT('tabe'[customer id]),

          'table'[Visit Count] = 3

      )/3

      The result gets me the number i'm looking for, but its a bandaid solution because I can't use >= 4. Any thoughts? We're looking to graph the number of clinets who visited once,twice, three times, etc.


      Thank you!