FabCon is coming to Atlanta
Join us at FabCon Atlanta from March 16 - 20, 2026, for the ultimate Fabric, Power BI, AI and SQL community-led event. Save $200 with code FABCOMM.
Register now!- Power BI forums
- Get Help with Power BI
- Desktop
- Service
- Report Server
- Power Query
- Mobile Apps
- Developer
- DAX Commands and Tips
- Custom Visuals Development Discussion
- Health and Life Sciences
- Power BI Spanish forums
- Translated Spanish Desktop
- Training and Consulting
- Instructor Led Training
- Dashboard in a Day for Women, by Women
- Galleries
- Data Stories Gallery
- Themes Gallery
- Contests Gallery
- Quick Measures Gallery
- Visual Calculations Gallery
- Notebook Gallery
- Translytical Task Flow Gallery
- TMDL Gallery
- R Script Showcase
- Webinars and Video Gallery
- Ideas
- Custom Visuals Ideas (read-only)
- Issues
- Issues
- Events
- Upcoming Events
Calling all Data Engineers! Fabric Data Engineer (Exam DP-700) live sessions are back! Starting October 16th. Sign up.
- Power BI forums
- Forums
- Get Help with Power BI
- Power Query
- Calculate orders for months open only
- Subscribe to RSS Feed
- Mark Topic as New
- Mark Topic as Read
- Float this Topic for Current User
- Bookmark
- Subscribe
- Printer Friendly Page

- Mark as New
- Bookmark
- Subscribe
- Mute
- Subscribe to RSS Feed
- Permalink
- Report Inappropriate Content
Calculate orders for months open only
We are a franchisor. I need to calculate inspection counts for our new owners for their first 12 months. starting months are unique to the owner. If they did not have any inspections for the month, want to insert a zero. However, if the owner current month is month 6, then don't want a zero in months 7 - 12 but rather a blank. Have an owner table that looks like this:
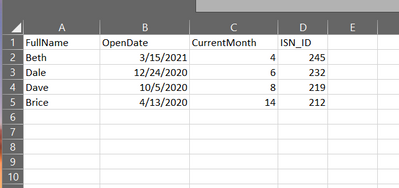
The order table looks like this:
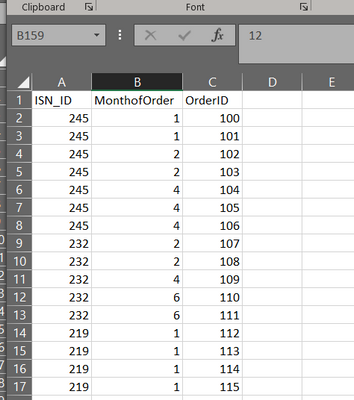
We want the results to look like this (this can either be a new table or just add 12 columns to the Owner Table... Month 01, Month 02, etc)

Sample data files are attached. My issue is getting a zero in the blank months before the current month, and the months after the current month staying blank (blank because they haven't been open that long). I can provide sample data files.
Chris
Solved! Go to Solution.


- Mark as New
- Bookmark
- Subscribe
- Mute
- Subscribe to RSS Feed
- Permalink
- Report Inappropriate Content
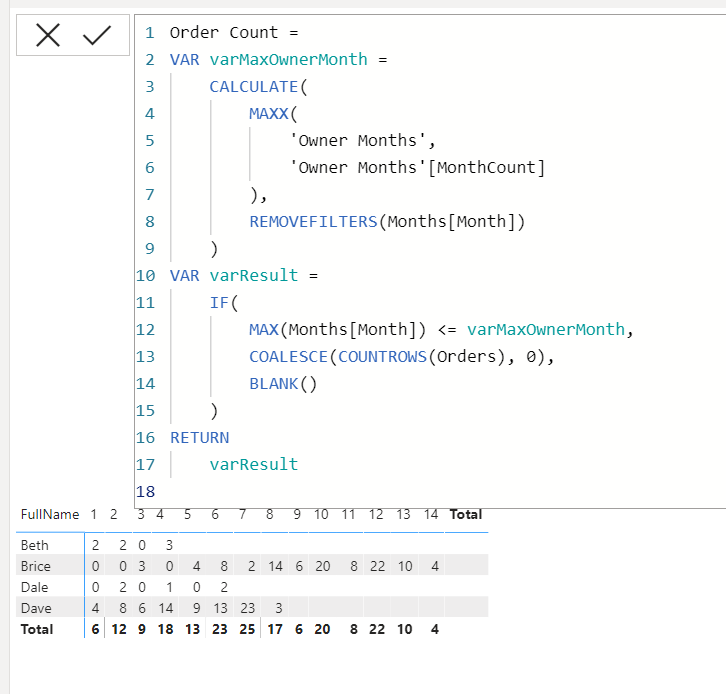
Try this @chrisazimmerman - see my PBIX because I had to do most of the modeling in Power Query for this to work, and then did this measure:
Order Count =
VAR varMaxOwnerMonth =
    CALCULATE(
        MAXX(
            'Owner Months',
            'Owner Months'[MonthCount]
        ),
        REMOVEFILTERS(Months[Month])
    )
VAR varResult =
    IF(
        MAX(Months[Month]) <= varMaxOwnerMonth,
        COALESCE(COUNTROWS(Orders), 0),
        BLANK()
    )
RETURN
    varResult
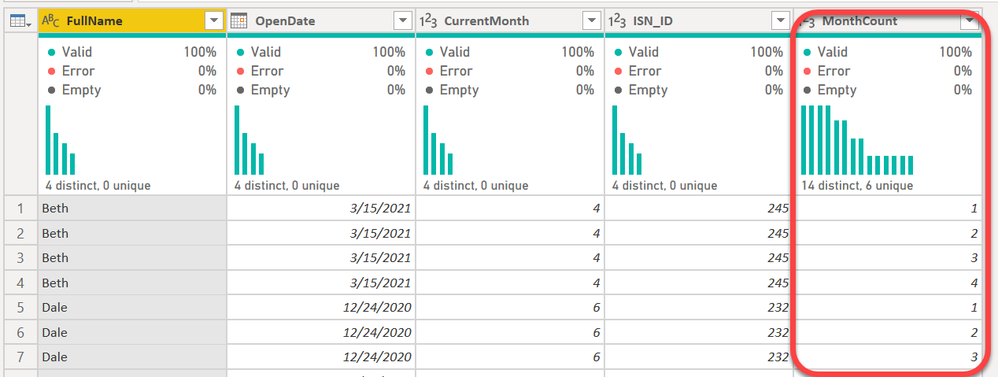
I created a table that referenced the Owners table and called it Owners Months. This table has 1 record for each desired month. Here are the first few rows. You can look at the M code to see exactly how it works, but the code for the row inquestion is below. 99% sure someone can simplify that, but this was my first non-optimiziation shot:
    #"Added MonthCount" =
        Table.AddColumn(
            Source,
            "MonthCount",
            each
                let
                    varMonths =
                        List.Count(
                            List.Distinct(
                                List.Transform(
                                    List.Transform(
                                        {
                                            Number.From(
                                                Date.StartOfMonth([OpenDate])
                                            )..
                                            Number.From(
                                                Date.EndOfMonth(
                                                    Date.AddMonths([OpenDate], [CurrentMonth])
                                                )
                                            )
                                        },
                                        each Date.From(_)
                                    ),
                                    each Date.Year(_) * 100 + Date.Month(_)
                                )
                            )
                        ) - 1
                in
                    {1..varMonths}

        ),
That probably looks complex, but it is a simple concept. Starting from the inside of that working out:
- Get the open date from the Owners file, and create a list of all dates from the start of that month through the end of the last month.
- Convert those to dates
- Convert that to a unique month/year field, so 202001, 202002, 202003, etc.
- Give me a distinct list of those
- Count them
- Subtract 1
Now I have a list of 1..n for each owner. I expanded that to get the column above in the final column.
I also created a Months table that just goes from 1 to 100. Think of this as a pseudo date table
This is the model. It is a set of two perfect Star Schemas. Owners and Months are DIM (Dimension) tables, and Owner Months and Orders are FACT tables.
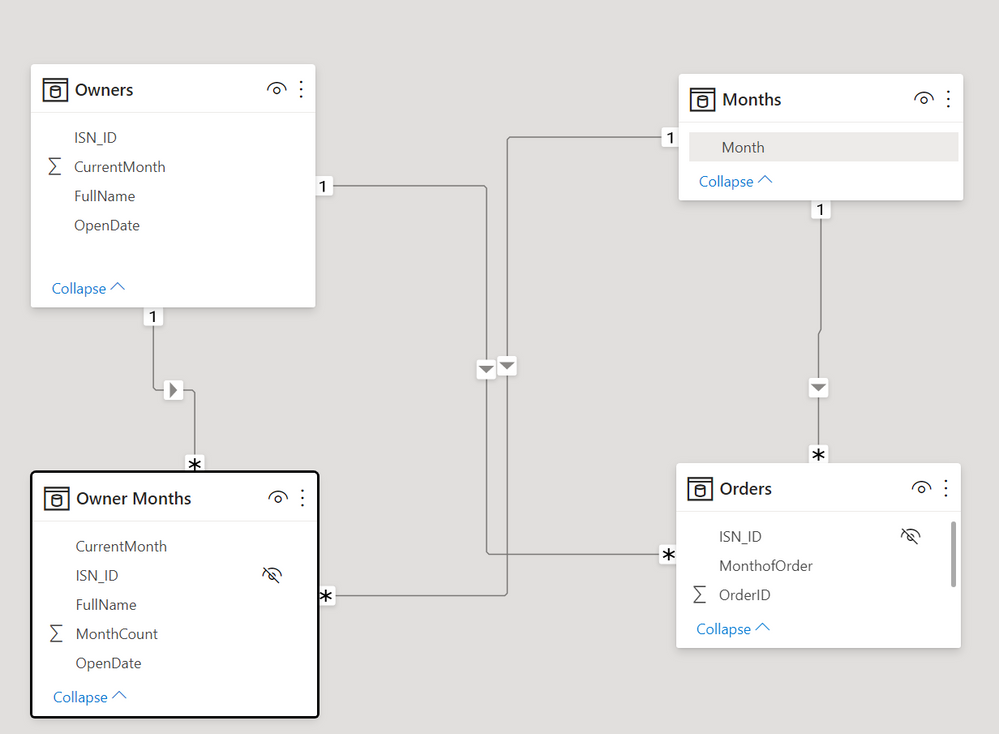
The result is the matrix shown above. Months from the months table in the columns, owner names in the rows, and the measure is what is above.
My file is here. I combined your 3 spreadsheets and am connecting to this single Excel file here. The only thing you might want to do is filter the table so it only shows the top 12 values, not 14 as Brice shows. You probalby don't want the total row either, so just remove that in the Matrix settings.
Did I answer your question? Mark my post as a solution!
Did my answers help arrive at a solution? Give it a kudos by clicking the Thumbs Up!
DAX is for Analysis. Power Query is for Data Modeling
Proud to be a Super User!
MCSA: BI Reporting- Mark as New
- Bookmark
- Subscribe
- Mute
- Subscribe to RSS Feed
- Permalink
- Report Inappropriate Content
I think this is what you want:
        let
            varToday = DateTime.Date(DateTime.LocalNow())
        in
        (Date.Year(varToday) - Date.Year([OpenDate])) * 12 +
            (Date.Month(varToday) - Date.Month(OpenDate)) + 1
You can do it without the variable, but then you have to repeat DateTime.Date(DateTime.LocalNow()) several times. that is the equivalent of TODAY()
I might not have my parenthesis in the same places you needed, so check the math.
Did I answer your question? Mark my post as a solution!
Did my answers help arrive at a solution? Give it a kudos by clicking the Thumbs Up!
DAX is for Analysis. Power Query is for Data Modeling
Proud to be a Super User!
MCSA: BI Reporting- Mark as New
- Bookmark
- Subscribe
- Mute
- Subscribe to RSS Feed
- Permalink
- Report Inappropriate Content
Data files weren't attached @chrisazimmerman
How to get good help fast. Help us help you.
How To Ask A Technical Question If you Really Want An Answer
How to Get Your Question Answered Quickly - Give us a good and concise explanation
How to provide sample data in the Power BI Forum - Provide data in a table format per the link, or share an Excel/CSV file via OneDrive, Dropbox, etc.. Provide expected output using a screenshot of Excel or other image. Do not provide a screenshot of the source data. I cannot paste an image into Power BI tables.
Did I answer your question? Mark my post as a solution!
Did my answers help arrive at a solution? Give it a kudos by clicking the Thumbs Up!
DAX is for Analysis. Power Query is for Data Modeling
Proud to be a Super User!
MCSA: BI Reporting- Mark as New
- Bookmark
- Subscribe
- Mute
- Subscribe to RSS Feed
- Permalink
- Report Inappropriate Content
Here are shared links to download sample files:
Orders Table: https://workdrive.zohoexternal.com/external/7cWxHkg2s99-MwUlZ/download
Owner Table: https://workdrive.zohoexternal.com/external/7cWxHkg2s97-MwUlZ/download
Results: https://workdrive.zohoexternal.com/external/7cWxHkg2s98-MwUlZ/download
- Mark as New
- Bookmark
- Subscribe
- Mute
- Subscribe to RSS Feed
- Permalink
- Report Inappropriate Content
Try this @chrisazimmerman - see my PBIX because I had to do most of the modeling in Power Query for this to work, and then did this measure:
Order Count =
VAR varMaxOwnerMonth =
    CALCULATE(
        MAXX(
            'Owner Months',
            'Owner Months'[MonthCount]
        ),
        REMOVEFILTERS(Months[Month])
    )
VAR varResult =
    IF(
        MAX(Months[Month]) <= varMaxOwnerMonth,
        COALESCE(COUNTROWS(Orders), 0),
        BLANK()
    )
RETURN
    varResult
I created a table that referenced the Owners table and called it Owners Months. This table has 1 record for each desired month. Here are the first few rows. You can look at the M code to see exactly how it works, but the code for the row inquestion is below. 99% sure someone can simplify that, but this was my first non-optimiziation shot:
    #"Added MonthCount" =
        Table.AddColumn(
            Source,
            "MonthCount",
            each
                let
                    varMonths =
                        List.Count(
                            List.Distinct(
                                List.Transform(
                                    List.Transform(
                                        {
                                            Number.From(
                                                Date.StartOfMonth([OpenDate])
                                            )..
                                            Number.From(
                                                Date.EndOfMonth(
                                                    Date.AddMonths([OpenDate], [CurrentMonth])
                                                )
                                            )
                                        },
                                        each Date.From(_)
                                    ),
                                    each Date.Year(_) * 100 + Date.Month(_)
                                )
                            )
                        ) - 1
                in
                    {1..varMonths}

        ),
That probably looks complex, but it is a simple concept. Starting from the inside of that working out:
- Get the open date from the Owners file, and create a list of all dates from the start of that month through the end of the last month.
- Convert those to dates
- Convert that to a unique month/year field, so 202001, 202002, 202003, etc.
- Give me a distinct list of those
- Count them
- Subtract 1
Now I have a list of 1..n for each owner. I expanded that to get the column above in the final column.
I also created a Months table that just goes from 1 to 100. Think of this as a pseudo date table
This is the model. It is a set of two perfect Star Schemas. Owners and Months are DIM (Dimension) tables, and Owner Months and Orders are FACT tables.
The result is the matrix shown above. Months from the months table in the columns, owner names in the rows, and the measure is what is above.
My file is here. I combined your 3 spreadsheets and am connecting to this single Excel file here. The only thing you might want to do is filter the table so it only shows the top 12 values, not 14 as Brice shows. You probalby don't want the total row either, so just remove that in the Matrix settings.
Did I answer your question? Mark my post as a solution!
Did my answers help arrive at a solution? Give it a kudos by clicking the Thumbs Up!
DAX is for Analysis. Power Query is for Data Modeling
Proud to be a Super User!
MCSA: BI Reporting- Mark as New
- Bookmark
- Subscribe
- Mute
- Subscribe to RSS Feed
- Permalink
- Report Inappropriate Content
Thanks Edhans. Appreciate all the work. This has been an outstanding challenge for us.
- Mark as New
- Bookmark
- Subscribe
- Mute
- Subscribe to RSS Feed
- Permalink
- Report Inappropriate Content
Great @chrisazimmerman - glad I was able to help. Sometimes the best Power BI solutions involve a little it of Power Query, a little bit of modeling, and a little bit of DAX. 😁
Did I answer your question? Mark my post as a solution!
Did my answers help arrive at a solution? Give it a kudos by clicking the Thumbs Up!
DAX is for Analysis. Power Query is for Data Modeling
Proud to be a Super User!
MCSA: BI Reporting- Mark as New
- Bookmark
- Subscribe
- Mute
- Subscribe to RSS Feed
- Permalink
- Report Inappropriate Content
One more question if you would. How do i write this DAX formula in Power Query (i'm pretty new to working in Power Query):
CurrentMonth = ((YEAR(TODAY()) - YEAR('Owners'[OpenDate].[Date]))*12)+((MONTH(TODAY()) - MONTH('Owners'[OpenDate].[Date]))+1)
- Mark as New
- Bookmark
- Subscribe
- Mute
- Subscribe to RSS Feed
- Permalink
- Report Inappropriate Content
I think this is what you want:
        let
            varToday = DateTime.Date(DateTime.LocalNow())
        in
        (Date.Year(varToday) - Date.Year([OpenDate])) * 12 +
            (Date.Month(varToday) - Date.Month(OpenDate)) + 1
You can do it without the variable, but then you have to repeat DateTime.Date(DateTime.LocalNow()) several times. that is the equivalent of TODAY()
I might not have my parenthesis in the same places you needed, so check the math.
Did I answer your question? Mark my post as a solution!
Did my answers help arrive at a solution? Give it a kudos by clicking the Thumbs Up!
DAX is for Analysis. Power Query is for Data Modeling
Proud to be a Super User!
MCSA: BI Reporting- Mark as New
- Bookmark
- Subscribe
- Mute
- Subscribe to RSS Feed
- Permalink
- Report Inappropriate Content
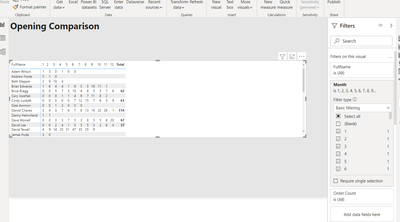
Your code is working beautifully. One additional question. I am filtering months to just first 12 months. If i have a row that hasn't completed 12 months, it won't calculate the column total. I can't seem to get this to work.

Helpful resources

FabCon Global Hackathon
Join the Fabric FabCon Global Hackathon—running virtually through Nov 3. Open to all skill levels. $10,000 in prizes!

Power BI Monthly Update - October 2025
Check out the October 2025 Power BI update to learn about new features.

FabCon Atlanta 2026
Join us at FabCon Atlanta, March 16-20, for the ultimate Fabric, Power BI, AI and SQL community-led event. Save $200 with code FABCOMM.


