Join us at FabCon Vienna from September 15-18, 2025
The ultimate Fabric, Power BI, SQL, and AI community-led learning event. Save €200 with code FABCOMM.
Get registered- Power BI forums
- Get Help with Power BI
- Desktop
- Service
- Report Server
- Power Query
- Mobile Apps
- Developer
- DAX Commands and Tips
- Custom Visuals Development Discussion
- Health and Life Sciences
- Power BI Spanish forums
- Translated Spanish Desktop
- Training and Consulting
- Instructor Led Training
- Dashboard in a Day for Women, by Women
- Galleries
- Data Stories Gallery
- Themes Gallery
- Contests Gallery
- Quick Measures Gallery
- Notebook Gallery
- Translytical Task Flow Gallery
- TMDL Gallery
- R Script Showcase
- Webinars and Video Gallery
- Ideas
- Custom Visuals Ideas (read-only)
- Issues
- Issues
- Events
- Upcoming Events
Enhance your career with this limited time 50% discount on Fabric and Power BI exams. Ends August 31st. Request your voucher.
- Power BI forums
- Forums
- Get Help with Power BI
- Desktop
- Re: using ALL or ALLEXCEPT to create measure which...
- Subscribe to RSS Feed
- Mark Topic as New
- Mark Topic as Read
- Float this Topic for Current User
- Bookmark
- Subscribe
- Printer Friendly Page

- Mark as New
- Bookmark
- Subscribe
- Mute
- Subscribe to RSS Feed
- Permalink
- Report Inappropriate Content
using ALL or ALLEXCEPT to create measure which ignores multiple slicers
I have a report which generates several versions of the same measure using or ignoring specific slicer selections. I can only get this to work if I construct my slicers from the fact table itself. I could just carry my labels on my fact table but that seems pretty messy. I'm either using the wrong DAX or I have to change the way my fact and dimension tables realate to one another. Below is a look at the statement which does work but only when I focus everything on the fact table. Also there is a simplified picture of the data. Any suggestions would be appreciated. Thanks.
Measure 3 = CALCULATE(AVERAGE(OrderFactTable[Revenue]), ALL(OrderFactTable[employee_id], OrderFactTable[product_id]))
This works but I'd prefer to do something like this below. Can't seem to get the DAX.
Measure 3 = CALCULATE(AVERAGE(OrderFactTable[Revenue]),ALL(Employee[employee_name], Product[product_name]))
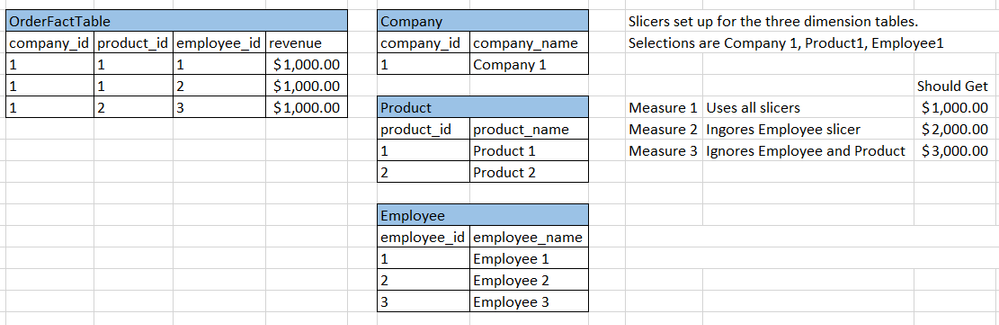
Solved! Go to Solution.


- Mark as New
- Bookmark
- Subscribe
- Mute
- Subscribe to RSS Feed
- Permalink
- Report Inappropriate Content
Hi @gregv5577,
You can create measures below:
Measure 1 = AVERAGE('OrderFactTable'[revenue])
Measure 2 =
DIVIDE(CALCULATE (
SUM ( OrderFactTable[revenue] ),
ALL ( Employee[employee_name] )
), CALCULATE (
DISTINCTCOUNT(OrderFactTable[product_id]),
ALL ( Employee[employee_name] )
) )
Measure 3 =
DIVIDE(CALCULATE (
SUM ( OrderFactTable[revenue] ),
ALL ( Employee[employee_name] ),ALL('Product'[product_name])),
CALCULATE (
DISTINCTCOUNT(OrderFactTable[company_id]),
ALL ( Employee[employee_name] ),ALL('Product'[product_name])))

You can see attached pbix file.
Best Regards,
Qiuyun Yu
If this post helps, then please consider Accept it as the solution to help the other members find it more quickly.


- Mark as New
- Bookmark
- Subscribe
- Mute
- Subscribe to RSS Feed
- Permalink
- Report Inappropriate Content
Hi @gregv5577
As an alternative...
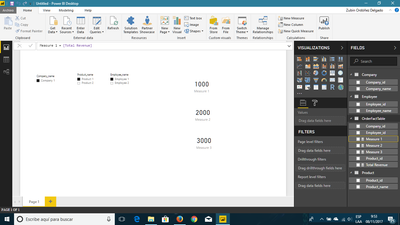
Measures:
Total Revenue = SUM(OrderFactTable[revenue])
Measure 1 = [Total Revenue]
Measure 2 = CALCULATE([Total Revenue];ALL(Employee[Employee_name]) )
Measure 3 = CALCULATE([Total Revenue];ALL(Employee[Employee_name]);ALL('Product'[Product_name]))I hope this helps
Regards
BILASolution
- Mark as New
- Bookmark
- Subscribe
- Mute
- Subscribe to RSS Feed
- Permalink
- Report Inappropriate Content
Hi @gregv5577
As an alternative...
Measures:
Total Revenue = SUM(OrderFactTable[revenue])
Measure 1 = [Total Revenue]
Measure 2 = CALCULATE([Total Revenue];ALL(Employee[Employee_name]) )
Measure 3 = CALCULATE([Total Revenue];ALL(Employee[Employee_name]);ALL('Product'[Product_name]))I hope this helps
Regards
BILASolution
- Mark as New
- Bookmark
- Subscribe
- Mute
- Subscribe to RSS Feed
- Permalink
- Report Inappropriate Content
Thanks very much. This is perfect.
- Mark as New
- Bookmark
- Subscribe
- Mute
- Subscribe to RSS Feed
- Permalink
- Report Inappropriate Content
Hi @gregv5577,
If our suggestions meet your requirement, would you please mark helpful replies as answers so we can close this thread? 
Best Regards,
Qiuyun Yu
If this post helps, then please consider Accept it as the solution to help the other members find it more quickly.
- Mark as New
- Bookmark
- Subscribe
- Mute
- Subscribe to RSS Feed
- Permalink
- Report Inappropriate Content
Hi @gregv5577,
You can create measures below:
Measure 1 = AVERAGE('OrderFactTable'[revenue])
Measure 2 =
DIVIDE(CALCULATE (
SUM ( OrderFactTable[revenue] ),
ALL ( Employee[employee_name] )
), CALCULATE (
DISTINCTCOUNT(OrderFactTable[product_id]),
ALL ( Employee[employee_name] )
) )
Measure 3 =
DIVIDE(CALCULATE (
SUM ( OrderFactTable[revenue] ),
ALL ( Employee[employee_name] ),ALL('Product'[product_name])),
CALCULATE (
DISTINCTCOUNT(OrderFactTable[company_id]),
ALL ( Employee[employee_name] ),ALL('Product'[product_name])))
You can see attached pbix file.
Best Regards,
Qiuyun Yu
If this post helps, then please consider Accept it as the solution to help the other members find it more quickly.

Helpful resources

Power BI Monthly Update - August 2025
Check out the August 2025 Power BI update to learn about new features.

Fabric Community Update - August 2025
Find out what's new and trending in the Fabric community.


| User | Count |
|---|---|
| 76 | |
| 70 | |
| 49 | |
| 40 | |
| 40 |


