FabCon is coming to Atlanta
Join us at FabCon Atlanta from March 16 - 20, 2026, for the ultimate Fabric, Power BI, AI and SQL community-led event. Save $200 with code FABCOMM.
Register now!- Power BI forums
- Get Help with Power BI
- Desktop
- Service
- Report Server
- Power Query
- Mobile Apps
- Developer
- DAX Commands and Tips
- Custom Visuals Development Discussion
- Health and Life Sciences
- Power BI Spanish forums
- Translated Spanish Desktop
- Training and Consulting
- Instructor Led Training
- Dashboard in a Day for Women, by Women
- Galleries
- Data Stories Gallery
- Themes Gallery
- Contests Gallery
- QuickViz Gallery
- Quick Measures Gallery
- Visual Calculations Gallery
- Notebook Gallery
- Translytical Task Flow Gallery
- TMDL Gallery
- R Script Showcase
- Webinars and Video Gallery
- Ideas
- Custom Visuals Ideas (read-only)
- Issues
- Issues
- Events
- Upcoming Events
Get Fabric Certified for FREE during Fabric Data Days. Don't miss your chance! Request now
- Power BI forums
- Forums
- Get Help with Power BI
- Desktop
- Re: radar chart filtered comparison
- Subscribe to RSS Feed
- Mark Topic as New
- Mark Topic as Read
- Float this Topic for Current User
- Bookmark
- Subscribe
- Printer Friendly Page

- Mark as New
- Bookmark
- Subscribe
- Mute
- Subscribe to RSS Feed
- Permalink
- Report Inappropriate Content
radar chart filtered comparison
Hi All,
Ive looked up various forms and dont seem to be able to see the answer and was hoping someone could help me.
Essentially I am trying to look at a radar chart but have two categories in them which can be manipulated with slicers.
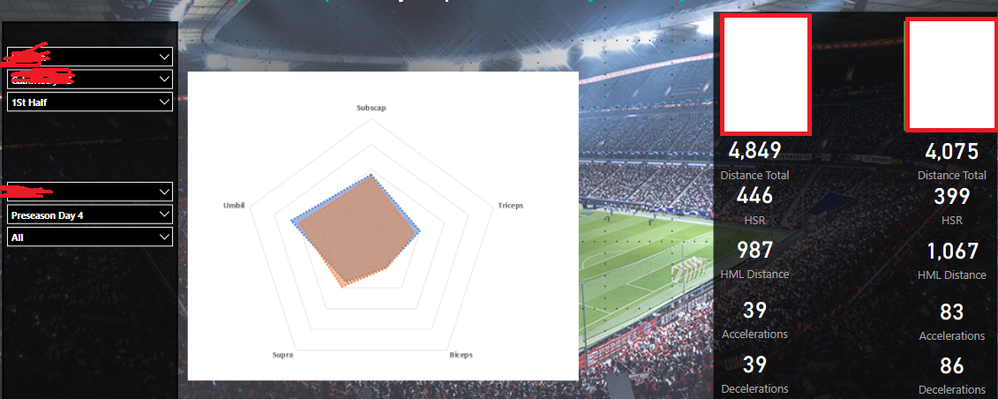
So in the photo this is what i am aiming for, the redded out slicers are names but as i change the name i want the radar chart to change to the corresponding player ect. I managed to do this with the values in the right hand side and the photo by changing interactions ect but wanted to know if the selected slicers could be put in the categories?
Thanks all aim not sure if i made sense but please send me a message for clarity
Solved! Go to Solution.


- Mark as New
- Bookmark
- Subscribe
- Mute
- Subscribe to RSS Feed
- Permalink
- Report Inappropriate Content
Hi @fajemile
Workaround:
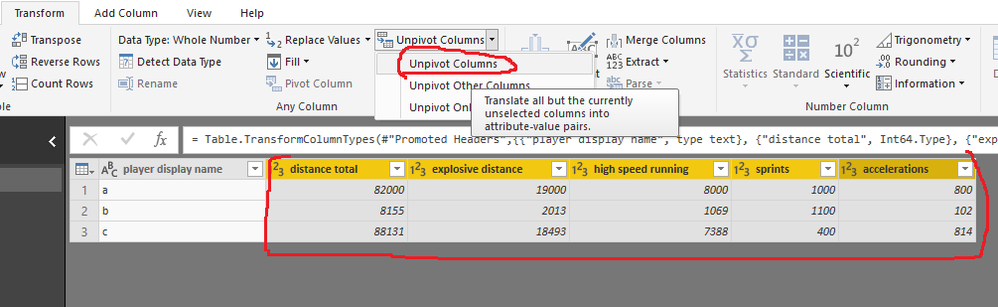
1.go to Edit Queries,
select columns (all columns you need to show as factor to compare) as below, then Unpivot columns
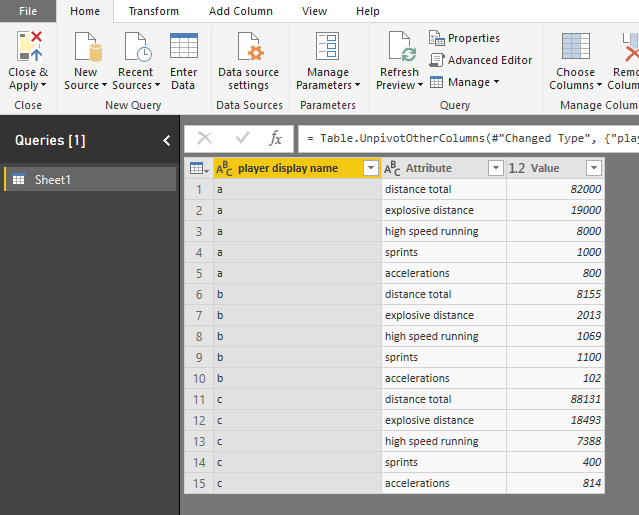
Close &&Apply
2. go to "Modeling"->New table
enter the code in the fomular bar
newTable1 = VALUES(Sheet1[player display name])
then create another new table by entering code
newTable2 = VALUES(Sheet1[player display name])
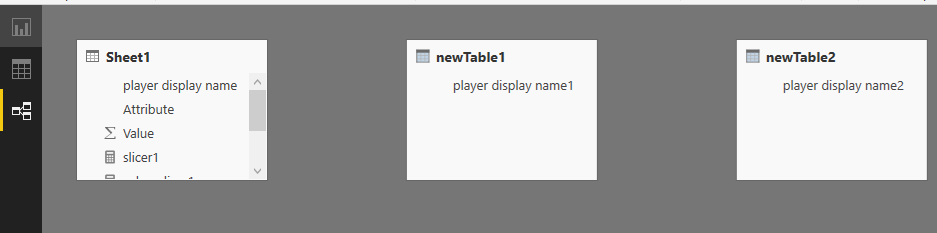
add columns "player display name1" in "newTable1", "player display name2" in "newTable2" in two slicer
note, don't create relationships between these tables, just keep it as below
3.create measures in "Sheet1"
slicer1 = ALLSELECTED(newTable1[player display name1])

slicer2 = SELECTEDVALUE(newTable2[player display name2])

value-slicer1 = CALCULATE(SUM(Sheet1[Value]),FILTER(Sheet1,Sheet1[player display name]=[slicer1]))

value-slicer2 = CALCULATE(SUM(Sheet1[Value]),FILTER(Sheet1,[player display name]=[slicer2]))

Best Regards
Maggie
- Mark as New
- Bookmark
- Subscribe
- Mute
- Subscribe to RSS Feed
- Permalink
- Report Inappropriate Content
Hi @fajemile
I don't understand your requirement.
Where is the the "redded out slicers"?
Are the values in the right hand side measures or columns from the table?
"if the selected slicers could be put in the categories"
which categories does the the slicers need to be put?
Could you show an example?
Reference:
Power BI Custom Visuals - Radar Chart
Multi-Variate Quantitative Analysis with Radar Charts in Power BI Desktop
Best Regards
Maggie
- Mark as New
- Bookmark
- Subscribe
- Mute
- Subscribe to RSS Feed
- Permalink
- Report Inappropriate Content
Thanks for the reply Maggie maybe this will make more sense
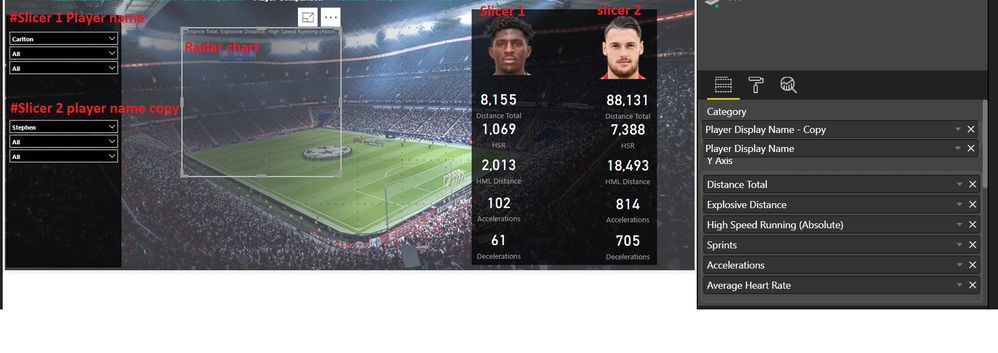

The redded out slicers are the names of the participants Carlton and Stephen. I want the player names to be put in categories and then interact with the two slicers so I would be able to do a direct comparison on the radar chart with Carlton and Stephen for the values put into the y axis but then if I change slicer 1 to manny now there is a comparison between manny and Stephen in the radar chart.
The values on the right are columns from a table this part is irrelevant but i put it there to show that at the moment I am comparing the participants by creating a copy of the player column and then changing the interactions between the slicers. So if I change slicer 1 to another player all the values and picture would change to the corresponding player.
Ideally like in the picture if I could put the slicer 1 and 2 in the categories field that would be perfect but I don't think it works and was hoping somebody had a work around
This is the aim but instead of team having slicer 2 there
- Mark as New
- Bookmark
- Subscribe
- Mute
- Subscribe to RSS Feed
- Permalink
- Report Inappropriate Content
Hi @fajemile
Workaround:
1.go to Edit Queries,
select columns (all columns you need to show as factor to compare) as below, then Unpivot columns
Close &&Apply
2. go to "Modeling"->New table
enter the code in the fomular bar
newTable1 = VALUES(Sheet1[player display name])
then create another new table by entering code
newTable2 = VALUES(Sheet1[player display name])
add columns "player display name1" in "newTable1", "player display name2" in "newTable2" in two slicer
note, don't create relationships between these tables, just keep it as below
3.create measures in "Sheet1"
slicer1 = ALLSELECTED(newTable1[player display name1])

slicer2 = SELECTEDVALUE(newTable2[player display name2])

value-slicer1 = CALCULATE(SUM(Sheet1[Value]),FILTER(Sheet1,Sheet1[player display name]=[slicer1]))

value-slicer2 = CALCULATE(SUM(Sheet1[Value]),FILTER(Sheet1,[player display name]=[slicer2]))
Best Regards
Maggie
- Mark as New
- Bookmark
- Subscribe
- Mute
- Subscribe to RSS Feed
- Permalink
- Report Inappropriate Content
Solved!
- Mark as New
- Bookmark
- Subscribe
- Mute
- Subscribe to RSS Feed
- Permalink
- Report Inappropriate Content
Hi @v-juanli-msft,
Thanks for your solution !. I've a question: for example if there is another field in the Sheet1 table, for example [Team], if i filter by the team, the two slicer [player display name1] and [player display name2] don't change because they aren't erlated. Do you know if there is any way to do it? for example, with a RELATEDTABLE?
Best regards.
- Mark as New
- Bookmark
- Subscribe
- Mute
- Subscribe to RSS Feed
- Permalink
- Report Inappropriate Content
Thank you for that amazing solution it was exatly what I was looking for!
I have however stumbled onto another hurdle. All the attriubutes are exactly how I want them and the radar chart is perfect the only problem now is that I cant get it to interact with the image custom visual. I have done an example with the file you attatched.
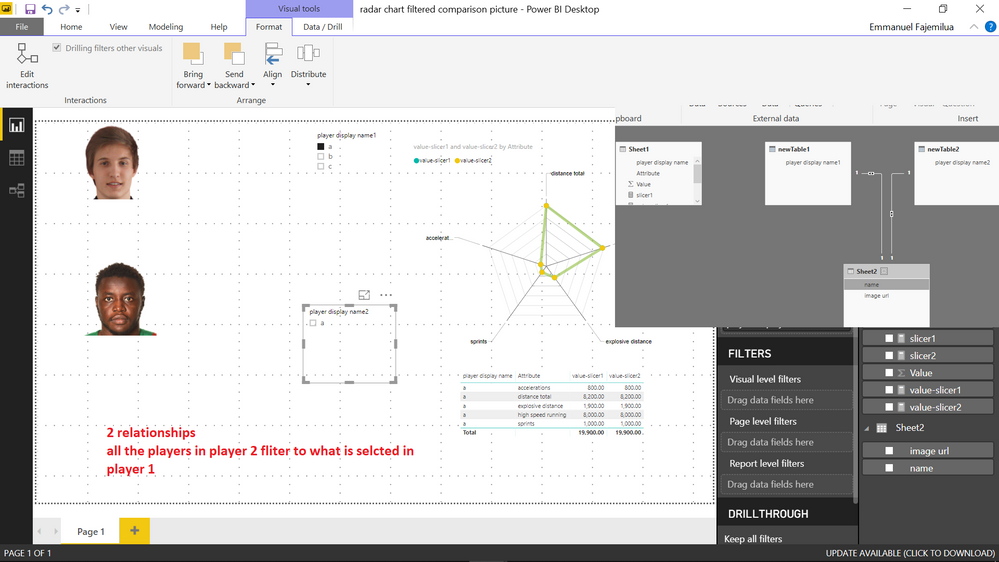
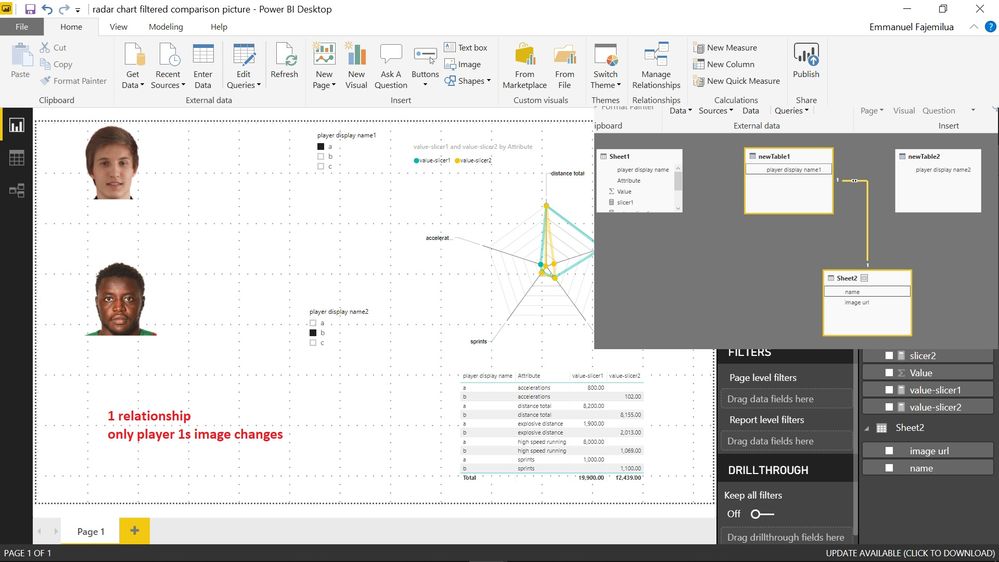
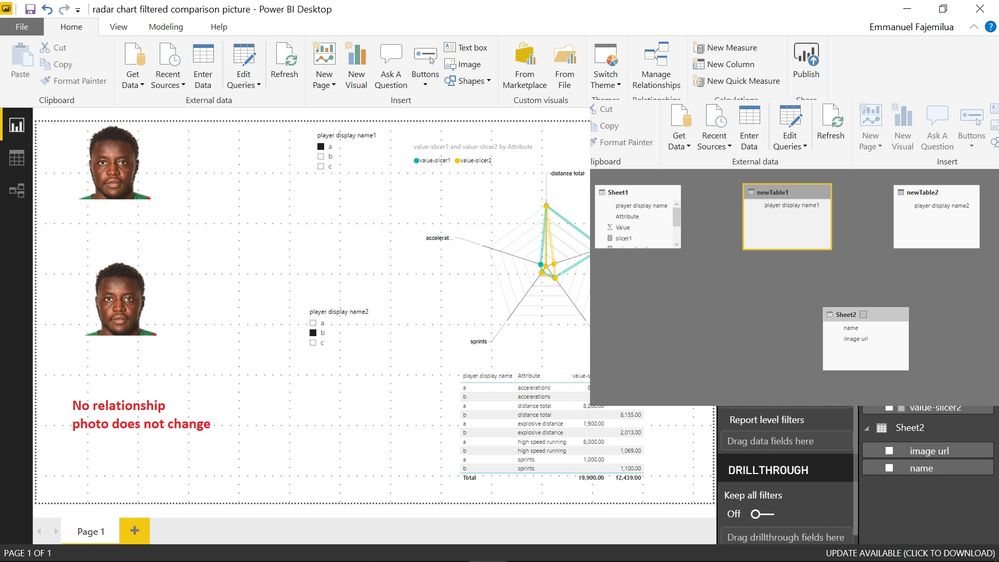
I am using the simple image custom visual. I know you said do not make a realtionship between the tables. I put in a new sheet with the image details in them, i then tested some of the tables relationships with the new sheet2(image sheet) to see which one would work. no relationship did not change the photos, 1 relationship changed 1 photo and 2 relationships flitered what was in the other slicer. I hope the photos make sense
- Mark as New
- Bookmark
- Subscribe
- Mute
- Subscribe to RSS Feed
- Permalink
- Report Inappropriate Content
Hi @fajemile
I try to only use one table, whenever i change the settings, it can't work well.
You need two tables with "name" and "photo url", then link each table to "newTable1" and "newTable2".
table1 link to "newTable1, table2 link to "newTable2".
Best Regards
Maggie
- Mark as New
- Bookmark
- Subscribe
- Mute
- Subscribe to RSS Feed
- Permalink
- Report Inappropriate Content
That's perfect thanks for the help Maggie
- Mark as New
- Bookmark
- Subscribe
- Mute
- Subscribe to RSS Feed
- Permalink
- Report Inappropriate Content
Note: That radar chart is just a picture from excel i wanted to use as an example of what I am aiming for. I would ideally like to use the data on the right hand side

Helpful resources

Power BI Monthly Update - November 2025
Check out the November 2025 Power BI update to learn about new features.

Fabric Data Days
Advance your Data & AI career with 50 days of live learning, contests, hands-on challenges, study groups & certifications and more!

FabCon Atlanta 2026
Join us at FabCon Atlanta, March 16-20, for the ultimate Fabric, Power BI, AI and SQL community-led event. Save $200 with code FABCOMM.


