Become a Certified Power BI Data Analyst!
Join us for an expert-led overview of the tools and concepts you'll need to pass exam PL-300. The first session starts on June 11th. See you there!
Get registered- Power BI forums
- Get Help with Power BI
- Desktop
- Service
- Report Server
- Power Query
- Mobile Apps
- Developer
- DAX Commands and Tips
- Custom Visuals Development Discussion
- Health and Life Sciences
- Power BI Spanish forums
- Translated Spanish Desktop
- Training and Consulting
- Instructor Led Training
- Dashboard in a Day for Women, by Women
- Galleries
- Webinars and Video Gallery
- Data Stories Gallery
- Themes Gallery
- Contests Gallery
- Quick Measures Gallery
- Notebook Gallery
- Translytical Task Flow Gallery
- R Script Showcase
- Ideas
- Custom Visuals Ideas (read-only)
- Issues
- Issues
- Events
- Upcoming Events
Power BI is turning 10! Let’s celebrate together with dataviz contests, interactive sessions, and giveaways. Register now.
- Power BI forums
- Forums
- Get Help with Power BI
- Desktop
- percentage calculator on Row wise
- Subscribe to RSS Feed
- Mark Topic as New
- Mark Topic as Read
- Float this Topic for Current User
- Bookmark
- Subscribe
- Printer Friendly Page


- Mark as New
- Bookmark
- Subscribe
- Mute
- Subscribe to RSS Feed
- Permalink
- Report Inappropriate Content
percentage calculator on Row wise
Hi All,
i am trying to calculate percentage on Row wise bust still am not able to do it..
SLA Met & SLA Not Met details in singal coloum.
Please help me on this.
Below is the table look like in excel 2016
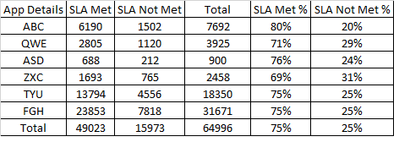
| App Details | SLA Met | SLA Not Met | Total | SLA Met % | SLA Not Met % |
| ABC | 6190 | 1502 | 7692 | 80% | 20% |
| QWE | 2805 | 1120 | 3925 | 71% | 29% |
| ASD | 688 | 212 | 900 | 76% | 24% |
| ZXC | 1693 | 765 | 2458 | 69% | 31% |
| TYU | 13794 | 4556 | 18350 | 75% | 25% |
| FGH | 23853 | 7818 | 31671 | 75% | 25% |
| Total | 49023 | 15973 | 64996 | 75% | 25% |
Thanks in Advance.
Regards,
Chethan
Solved! Go to Solution.


- Mark as New
- Bookmark
- Subscribe
- Mute
- Subscribe to RSS Feed
- Permalink
- Report Inappropriate Content
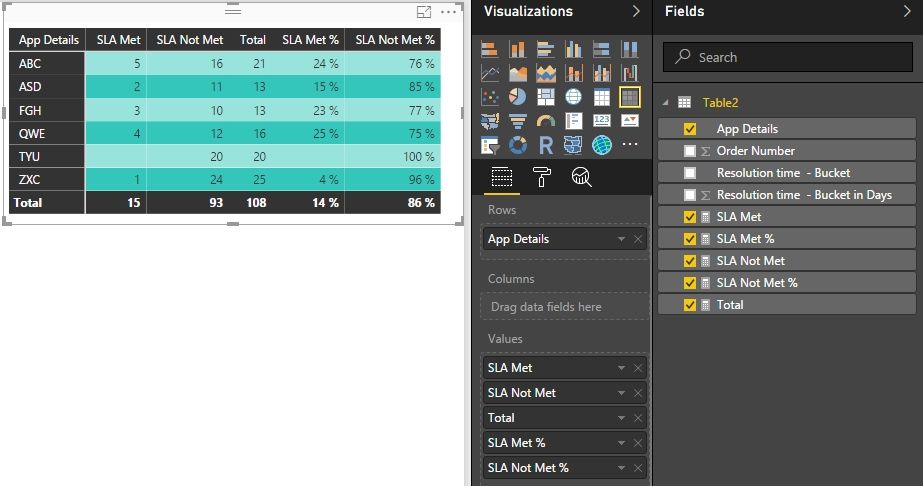
Just create some measures one by one as below should be OK.
SLA Met =
CALCULATE (
    SUM ( Table2[Resolution time  - Bucket in Days] ),
    FILTER ( Table2, Table2[Resolution time  - Bucket] = "SLA Met" )
)
SLA Not Met =
CALCULATE (
SUM ( Table2[Resolution time - Bucket in Days] ),
FILTER ( Table2, Table2[Resolution time - Bucket] = "SLA Not Met" )
)Total =
CALCULATE (
SUM ( Table2[Resolution time - Bucket in Days] ),
ALLEXCEPT ( Table2, Table2[App Details] )
)SLA Met % = [SLA Met] / [Total]
SLA Not Met % = [SLA Not Met] / [Total]
Best Regards,
Herbert
- Mark as New
- Bookmark
- Subscribe
- Mute
- Subscribe to RSS Feed
- Permalink
- Report Inappropriate Content
You can follow the steps mentioned by BhaveshPatel, or you can create two calculated columns as below.
SLA Met % = Table1[SLA Met] / Table1[Total]
SLA Not Met % = Table1[SLA Not Met] / Table1[Total]

Best Regards,
Herbert
- Mark as New
- Bookmark
- Subscribe
- Mute
- Subscribe to RSS Feed
- Permalink
- Report Inappropriate Content
Hi
Thanks for replay i have tryed the same its working fine for the table editing or queries Editing their is no problem..
but i need to showcase the date in dashboard am using Matrix Visulation
Below is the my backed table data
| Order Number | App Details | Resolution time - Bucket in Days | Resolution time - Bucket |
| 14578980912 | ABC | 2 | SLA Met |
| 14578988312 | QWE | 12 | SLA Not Met |
| 14578988412 | ASD | 1 | SLA Met |
| 14578990312 | ZXC | 4 | SLA Not Met |
| 14578999112 | TYU | 10 | SLA Not Met |
| 14579011012 | FGH | 5 | SLA Not Met |
| 14579016812 | ABC | 9 | SLA Not Met |
| 14579020812 | QWE | 1 | SLA Met |
| 14579022912 | ASD | 4 | SLA Not Met |
| 14579023712 | ZXC | 8 | SLA Not Met |
| 14579026012 | TYU | 6 | SLA Not Met |
| 14579027612 | FGH | 3 | SLA Met |
| 14579040012 | ABC | 7 | SLA Not Met |
| 14579043612 | QWE | 1 | SLA Met |
| 14579051012 | ASD | 7 | SLA Not Met |
| 14579053512 | ZXC | 1 | SLA Met |
| 14579058312 | TYU | 4 | SLA Not Met |
| 14579065112 | FGH | 5 | SLA Not Met |
| 14579071612 | ABC | 3 | SLA Met |
| 14579075212 | QWE | 2 | SLA Met |
| 15579113501 | ASD | 1 | SLA Met |
| 15579114301 | ZXC | 12 | SLA Not Met |
Below i need to be look like in the dashboard
| App Details | SLA Met | SLA Not Met | Total | SLA Met % | SLA Not Met % |
| ABC | 6190 | 1502 | 7692 | 80% | 20% |
| QWE | 2805 | 1120 | 3925 | 71% | 29% |
| ASD | 688 | 212 | 900 | 76% | 24% |
| ZXC | 1693 | 765 | 2458 | 69% | 31% |
| TYU | 13794 | 4556 | 18350 | 75% | 25% |
| FGH | 23853 | 7818 | 31671 | 75% | 25% |
| Total | 49023 | 15973 | 64996 | 75% | 25% |
Please help me on this..
Regards,
Chethan
- Mark as New
- Bookmark
- Subscribe
- Mute
- Subscribe to RSS Feed
- Permalink
- Report Inappropriate Content
Just create some measures one by one as below should be OK.
SLA Met =
CALCULATE (
    SUM ( Table2[Resolution time  - Bucket in Days] ),
    FILTER ( Table2, Table2[Resolution time  - Bucket] = "SLA Met" )
)
SLA Not Met =
CALCULATE (
SUM ( Table2[Resolution time - Bucket in Days] ),
FILTER ( Table2, Table2[Resolution time - Bucket] = "SLA Not Met" )
)Total =
CALCULATE (
SUM ( Table2[Resolution time - Bucket in Days] ),
ALLEXCEPT ( Table2, Table2[App Details] )
)SLA Met % = [SLA Met] / [Total]
SLA Not Met % = [SLA Not Met] / [Total]
Best Regards,
Herbert
- Mark as New
- Bookmark
- Subscribe
- Mute
- Subscribe to RSS Feed
- Permalink
- Report Inappropriate Content


- Mark as New
- Bookmark
- Subscribe
- Mute
- Subscribe to RSS Feed
- Permalink
- Report Inappropriate Content
Hi Chetan
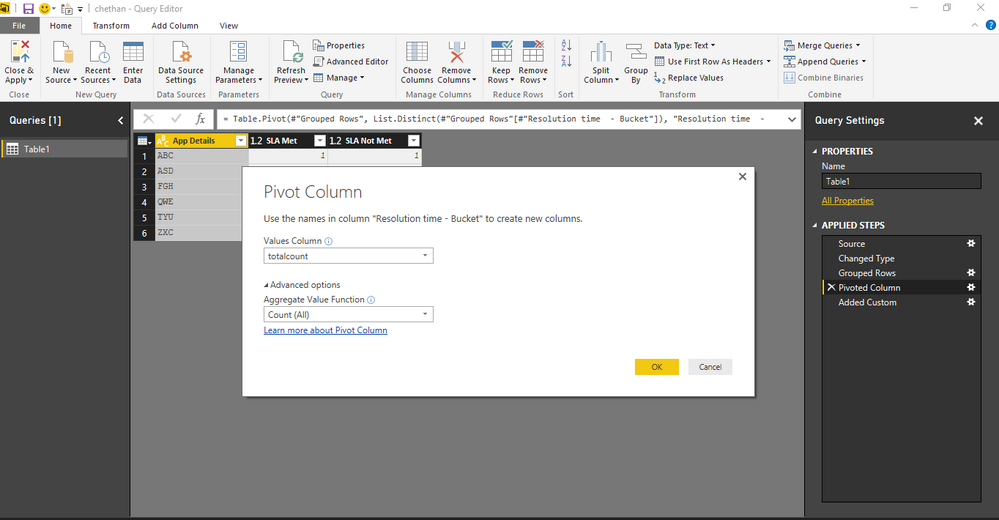
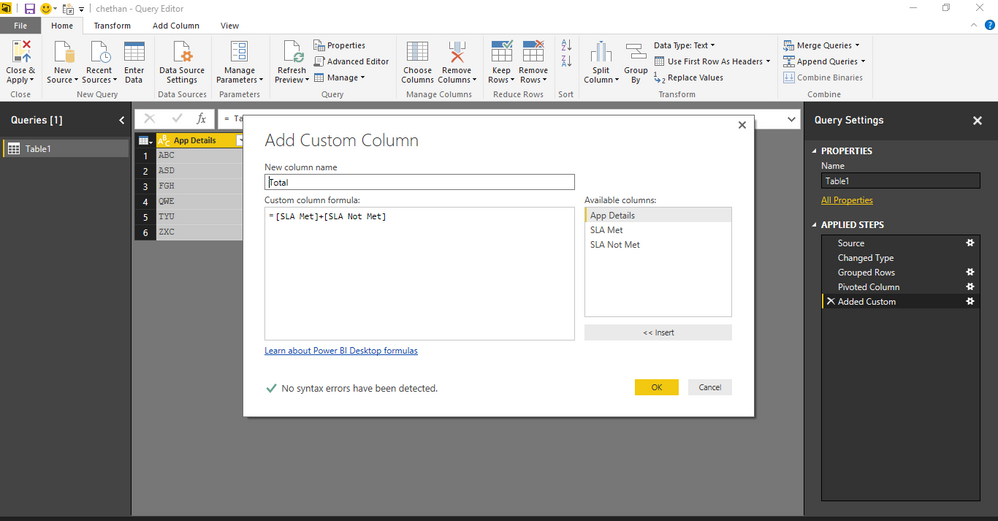
I have created a solution using Query Editor, Thanks@Herbert_Liu for posting a DAX Solution.
Please follow the attached screenshots for the solution created by Query Editor

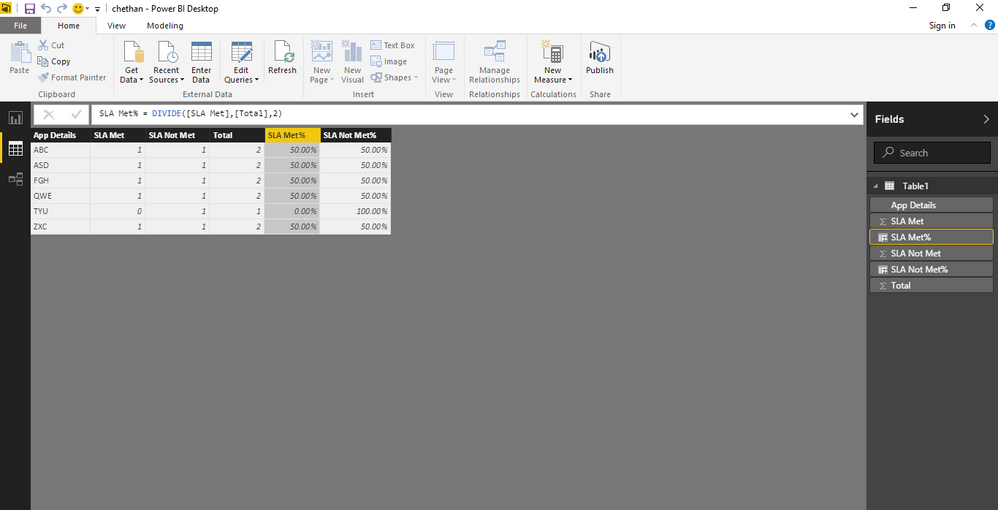
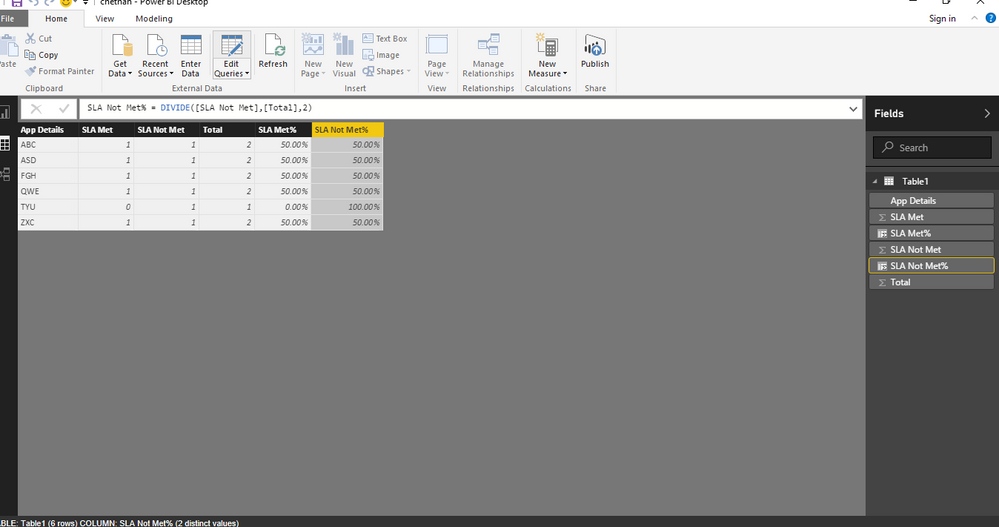
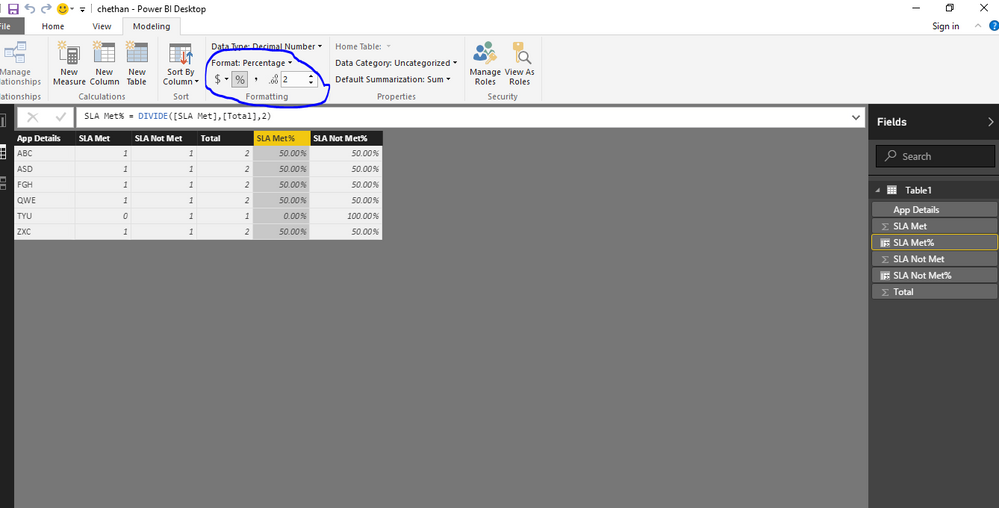
Bhavesh
Love the Self Service BI.
Please use the 'Mark as answer' link to mark a post that answers your question. If you find a reply helpful, please remember to give Kudos.
- Mark as New
- Bookmark
- Subscribe
- Mute
- Subscribe to RSS Feed
- Permalink
- Report Inappropriate Content
Hi Chethan,
You can use Quick Calc functionality in PowerBI to achieve expected results without writing any DAX.
For more info, See this VIDEO.
Alternatively, You can use DAX for this Calculation, More work but can learn you intuitive behaviour of DAX.
Create 2 measures,
For Grand Total
GrandTotal:=CALCULATE(SUM(SLA[SLA Met]),ALL(SLA))
SLA -- Name of your Table
SLASUM:=SUM(SLA[SLA Met])
Percentage:=DIVIDE([SLASUM],[GrandTotal],2)
Similarly, Create the measures for SLA Not met as well.
Bhavesh
Love the Self Service BI.
Please use the 'Mark as answer' link to mark a post that answers your question. If you find a reply helpful, please remember to give Kudos.

Helpful resources

Power BI Monthly Update - June 2025
Check out the June 2025 Power BI update to learn about new features.

Fabric Community Update - June 2025
Find out what's new and trending in the Fabric community.

| User | Count |
|---|---|
| 84 | |
| 78 | |
| 70 | |
| 47 | |
| 41 |


| User | Count |
|---|---|
| 108 | |
| 52 | |
| 50 | |
| 40 | |
| 40 |


