FabCon is coming to Atlanta
Join us at FabCon Atlanta from March 16 - 20, 2026, for the ultimate Fabric, Power BI, AI and SQL community-led event. Save $200 with code FABCOMM.
Register now!- Power BI forums
- Get Help with Power BI
- Desktop
- Service
- Report Server
- Power Query
- Mobile Apps
- Developer
- DAX Commands and Tips
- Custom Visuals Development Discussion
- Health and Life Sciences
- Power BI Spanish forums
- Translated Spanish Desktop
- Training and Consulting
- Instructor Led Training
- Dashboard in a Day for Women, by Women
- Galleries
- Data Stories Gallery
- Themes Gallery
- Contests Gallery
- QuickViz Gallery
- Quick Measures Gallery
- Visual Calculations Gallery
- Notebook Gallery
- Translytical Task Flow Gallery
- TMDL Gallery
- R Script Showcase
- Webinars and Video Gallery
- Ideas
- Custom Visuals Ideas (read-only)
- Issues
- Issues
- Events
- Upcoming Events
View all the Fabric Data Days sessions on demand. View schedule
- Power BI forums
- Forums
- Get Help with Power BI
- Desktop
- Re: how can i select top records from a table havi...
- Subscribe to RSS Feed
- Mark Topic as New
- Mark Topic as Read
- Float this Topic for Current User
- Bookmark
- Subscribe
- Printer Friendly Page


- Mark as New
- Bookmark
- Subscribe
- Mute
- Subscribe to RSS Feed
- Permalink
- Report Inappropriate Content
how can i select top records from a table having their sum equal to a value
hello,
i have to select top records , the structure is simple, id, date and value, and for each date, i have to get the first records for which the sum of value = 0.7* total value for each day something like this
| Data | ||||||||
| id | day | value | ||||||
| id1 | 01.01.2000 | 10 | ||||||
| id2 | 01.01.2000 | 4 | ||||||
| id3 | 01.01.2000 | 5 | Temp | |||||
| id4 | 01.01.2000 | 7 | ||||||
| id5 | 01.01.2000 | 5 | Total | Total 70% | ||||
| id6 | 01.01.2000 | 8 | 01.01.2000 | 39 | 27.3 | |||
| id7 | 01.02.2000 | 12 | 01.02.2000 | 42 | 29.4 | |||
| id8 | 01.02.2000 | 9 | 01.03.2000 | 35 | 24.5 | |||
| id9 | 01.02.2000 | 6 | ||||||
| id10 | 01.02.2000 | 8 | ||||||
| id11 | 01.02.2000 | 4 | ||||||
| id12 | 01.02.2000 | 3 | ||||||
| id13 | 01.03.2000 | 11 | ||||||
| id14 | 01.03.2000 | 3 | ||||||
| id15 | 01.03.2000 | 3 | ||||||
| id16 | 01.03.2000 | 7 | ||||||
| id17 | 01.03.2000 | 9 | ||||||
| id18 | 01.03.2000 | 2 | ||||||
| RESULT | ||||||||
| id | day | value | ||||||
| id1 | 01.01.2000 | 10 | ||||||
| id6 | 01.01.2000 | 8 | ||||||
| id4 | 01.01.2000 | 7 | ||||||
| id7 | 01.02.2000 | 12 | ||||||
| id8 | 01.02.2000 | 9 | ||||||
| id10 | 01.02.2000 | 8 | ||||||
| id13 | 01.03.2000 | 11 | ||||||
| id17 | 01.03.2000 | 9 |
Thank you
Solved! Go to Solution.


- Mark as New
- Bookmark
- Subscribe
- Mute
- Subscribe to RSS Feed
- Permalink
- Report Inappropriate Content
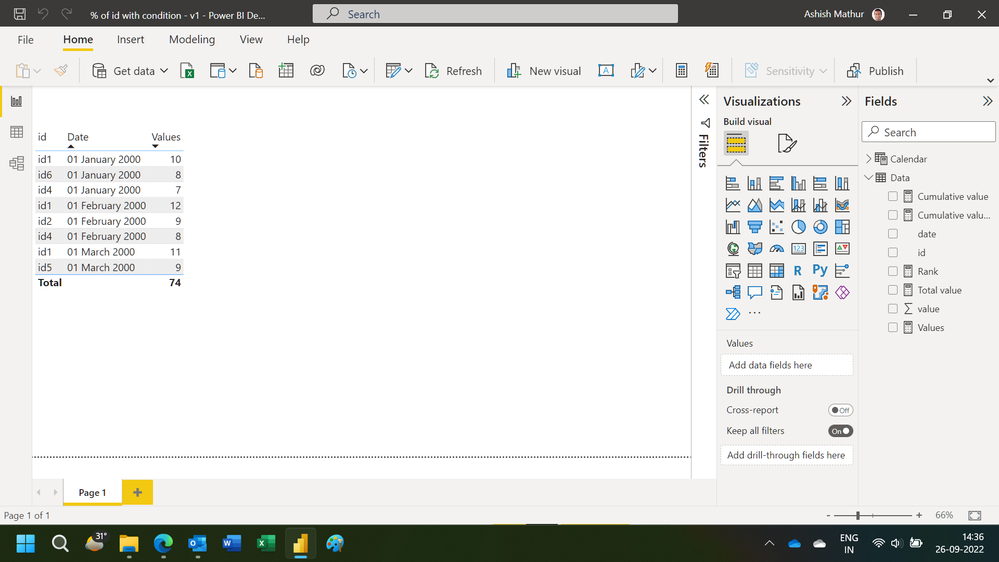
You may download my revised PBI file from here.
Hope this helps.
Regards,
Ashish Mathur
http://www.ashishmathur.com
https://www.linkedin.com/in/excelenthusiasts/
- Mark as New
- Bookmark
- Subscribe
- Mute
- Subscribe to RSS Feed
- Permalink
- Report Inappropriate Content
You may download my revised PBI file from here.
Hope this helps.
Regards,
Ashish Mathur
http://www.ashishmathur.com
https://www.linkedin.com/in/excelenthusiasts/
- Mark as New
- Bookmark
- Subscribe
- Mute
- Subscribe to RSS Feed
- Permalink
- Report Inappropriate Content
Thank you verry much!
- Mark as New
- Bookmark
- Subscribe
- Mute
- Subscribe to RSS Feed
- Permalink
- Report Inappropriate Content
You are welcome.
Regards,
Ashish Mathur
http://www.ashishmathur.com
https://www.linkedin.com/in/excelenthusiasts/
- Mark as New
- Bookmark
- Subscribe
- Mute
- Subscribe to RSS Feed
- Permalink
- Report Inappropriate Content
Hi,
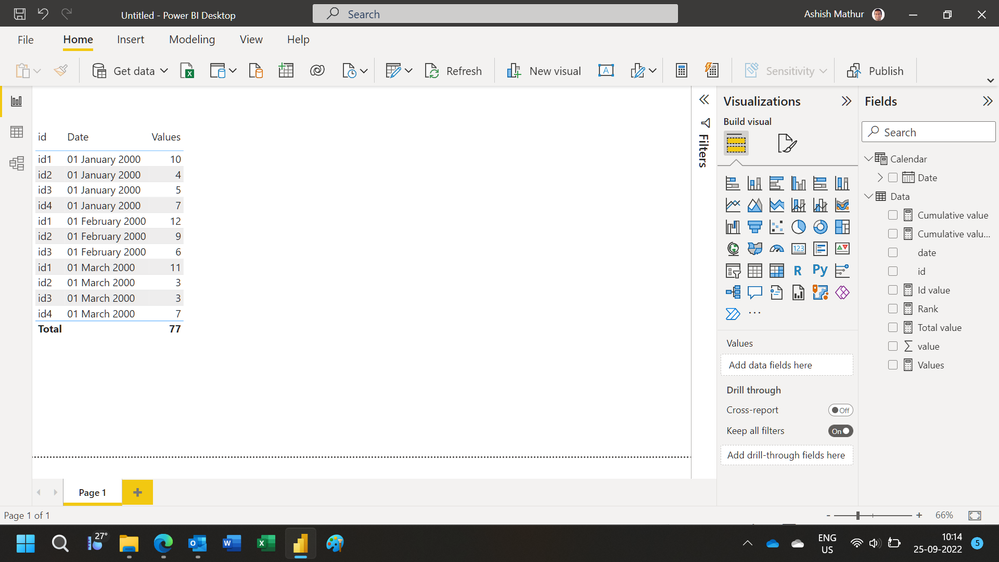
You may download my PBI file from here.
Hope this helps.
Regards,
Ashish Mathur
http://www.ashishmathur.com
https://www.linkedin.com/in/excelenthusiasts/
- Mark as New
- Bookmark
- Subscribe
- Mute
- Subscribe to RSS Feed
- Permalink
- Report Inappropriate Content
thank you very much, can you help me change it so it orders by values not by id? i made a mistake when i write the example. thank you
- Mark as New
- Bookmark
- Subscribe
- Mute
- Subscribe to RSS Feed
- Permalink
- Report Inappropriate Content
You are welcome. You have completely changed the example. Show the expected result very clearly.
Regards,
Ashish Mathur
http://www.ashishmathur.com
https://www.linkedin.com/in/excelenthusiasts/
- Mark as New
- Bookmark
- Subscribe
- Mute
- Subscribe to RSS Feed
- Permalink
- Report Inappropriate Content
i've change it. thank you, it is possible to make a new table having the result structure?

- Mark as New
- Bookmark
- Subscribe
- Mute
- Subscribe to RSS Feed
- Permalink
- Report Inappropriate Content
- Mark as New
- Bookmark
- Subscribe
- Mute
- Subscribe to RSS Feed
- Permalink
- Report Inappropriate Content
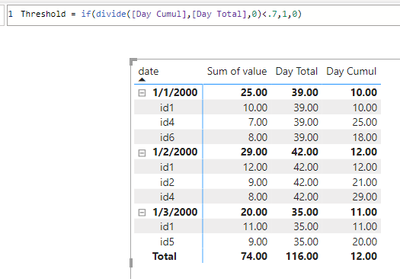
Hello, you were right , i need the sort order to be values descending, i have a small problema beacuse i don't understand how it calculate the day cumul, when o apply the example to my data, it result something like this
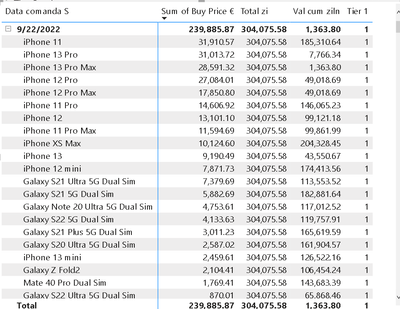
and i don;t understand from where it gets the value for iphone 13 pro, pro max...
the formula is

Helpful resources

Power BI Monthly Update - November 2025
Check out the November 2025 Power BI update to learn about new features.

Fabric Data Days
Advance your Data & AI career with 50 days of live learning, contests, hands-on challenges, study groups & certifications and more!

FabCon Atlanta 2026
Join us at FabCon Atlanta, March 16-20, for the ultimate Fabric, Power BI, AI and SQL community-led event. Save $200 with code FABCOMM.


