- Power BI forums
- Updates
- News & Announcements
- Get Help with Power BI
- Desktop
- Service
- Report Server
- Power Query
- Mobile Apps
- Developer
- DAX Commands and Tips
- Custom Visuals Development Discussion
- Health and Life Sciences
- Power BI Spanish forums
- Translated Spanish Desktop
- Power Platform Integration - Better Together!
- Power Platform Integrations (Read-only)
- Power Platform and Dynamics 365 Integrations (Read-only)
- Training and Consulting
- Instructor Led Training
- Dashboard in a Day for Women, by Women
- Galleries
- Community Connections & How-To Videos
- COVID-19 Data Stories Gallery
- Themes Gallery
- Data Stories Gallery
- R Script Showcase
- Webinars and Video Gallery
- Quick Measures Gallery
- 2021 MSBizAppsSummit Gallery
- 2020 MSBizAppsSummit Gallery
- 2019 MSBizAppsSummit Gallery
- Events
- Ideas
- Custom Visuals Ideas
- Issues
- Issues
- Events
- Upcoming Events
- Community Blog
- Power BI Community Blog
- Custom Visuals Community Blog
- Community Support
- Community Accounts & Registration
- Using the Community
- Community Feedback
Register now to learn Fabric in free live sessions led by the best Microsoft experts. From Apr 16 to May 9, in English and Spanish.
- Power BI forums
- Forums
- Get Help with Power BI
- Desktop
- Re: display all the rows of first column that were...
- Subscribe to RSS Feed
- Mark Topic as New
- Mark Topic as Read
- Float this Topic for Current User
- Bookmark
- Subscribe
- Printer Friendly Page

- Mark as New
- Bookmark
- Subscribe
- Mute
- Subscribe to RSS Feed
- Permalink
- Report Inappropriate Content
display all the rows of first column that were filtered by a second column
| Column 1 | Column 2 | Flag |
| A | B | 1 |
| B | C | 1 |
| D | A | 1 |
| E | D | 1 |
I have a table like this. I am able to filter the table by both the columns using a measure. For example, the output table for a filter on both columns 1 and 2 for 'B' looks like this
| Column 1 | Column 2 | Flag |
| A | B | 1 |
| B | C | 1 |
I want a visual that displays only Column 1 and Flag in a Matrix form. The visual I get at the moment
| Column 1 | Flag |
| B | 1 |
However, I want my visual to look like below
| Column 1 | Flag |
| A | 1 |
| B | 1 |
Can somebody please help?
Solved! Go to Solution.


- Mark as New
- Bookmark
- Subscribe
- Mute
- Subscribe to RSS Feed
- Permalink
- Report Inappropriate Content
Assuming you have a Disconnected Table with values in both Column 1 and Column 2. If you have that already, good, other wise, you can create that like with a New Calculated Table like this:
Add the column from your disconnected slicer to the Filters Pane.
Then create a Measure for your flag as below
FlagDisplay =
CALCULATE (
SUM ( 'MyTable'[Flag] ),
KEEPFILTERS (
'MyTable'[Column1]
IN VALUES ( CombinedValues[Slice] )
|| 'MyTable'[Column2] IN VALUES ( CombinedValues[Slice] )
)
)
If this works for you, please mark it as a solution so it can be found easily by anyone who may have similar issues.
- Mark as New
- Bookmark
- Subscribe
- Mute
- Subscribe to RSS Feed
- Permalink
- Report Inappropriate Content
Assuming you have a Disconnected Table with values in both Column 1 and Column 2. If you have that already, good, other wise, you can create that like with a New Calculated Table like this:
Add the column from your disconnected slicer to the Filters Pane.
Then create a Measure for your flag as below
FlagDisplay =
CALCULATE (
SUM ( 'MyTable'[Flag] ),
KEEPFILTERS (
'MyTable'[Column1]
IN VALUES ( CombinedValues[Slice] )
|| 'MyTable'[Column2] IN VALUES ( CombinedValues[Slice] )
)
)
If this works for you, please mark it as a solution so it can be found easily by anyone who may have similar issues.
- Mark as New
- Bookmark
- Subscribe
- Mute
- Subscribe to RSS Feed
- Permalink
- Report Inappropriate Content
It works, thank you


- Mark as New
- Bookmark
- Subscribe
- Mute
- Subscribe to RSS Feed
- Permalink
- Report Inappropriate Content
Hi,
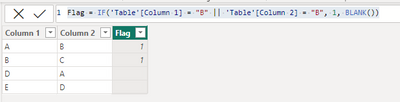
In this case I suggest you use a calculated column with the following formula:
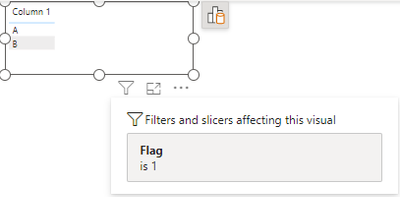
After that, add a filter in the visual using this field set to 1.
- Mark as New
- Bookmark
- Subscribe
- Mute
- Subscribe to RSS Feed
- Permalink
- Report Inappropriate Content
that's what I have in the 2nd table. I want a visual table that doesn't include Column 2 but still gives me all rows filtered in Column 1
- Mark as New
- Bookmark
- Subscribe
- Mute
- Subscribe to RSS Feed
- Permalink
- Report Inappropriate Content
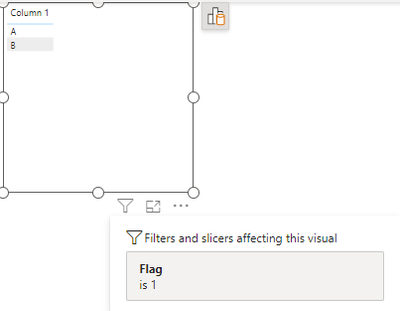
Yes, please try to follow my suggestion and don't add the second column, it will work 😊
- Mark as New
- Bookmark
- Subscribe
- Mute
- Subscribe to RSS Feed
- Permalink
- Report Inappropriate Content
yes but this is dynamic, I want it to filter based on a Slicer
- Mark as New
- Bookmark
- Subscribe
- Mute
- Subscribe to RSS Feed
- Permalink
- Report Inappropriate Content
Is "flag" a numeric column?
- Mark as New
- Bookmark
- Subscribe
- Mute
- Subscribe to RSS Feed
- Permalink
- Report Inappropriate Content
yes


- Mark as New
- Bookmark
- Subscribe
- Mute
- Subscribe to RSS Feed
- Permalink
- Report Inappropriate Content
How many slicers do you have ?and what are all the columns you are using?
Thanks,
Arul
- Mark as New
- Bookmark
- Subscribe
- Mute
- Subscribe to RSS Feed
- Permalink
- Report Inappropriate Content
just one slicer which has combined values of both column 1 and column 2.

Helpful resources

Microsoft Fabric Learn Together
Covering the world! 9:00-10:30 AM Sydney, 4:00-5:30 PM CET (Paris/Berlin), 7:00-8:30 PM Mexico City

Power BI Monthly Update - April 2024
Check out the April 2024 Power BI update to learn about new features.

Fabric Community Update - April 2024
Find out what's new and trending in the Fabric Community.

| User | Count |
|---|---|
| 107 | |
| 93 | |
| 77 | |
| 65 | |
| 53 |


| User | Count |
|---|---|
| 147 | |
| 106 | |
| 104 | |
| 87 | |
| 61 |


