@Eric_Zhang - On my top 10 customers for each brand, i want my measure to look at what the total gross profit by month for the customer that is selected divided by the total sales $. The data for my Power BI dashboard is taken from an excel pivot table. Below is a picture of some sales data for one of my top customers Pacific Foods in December 2016. Currently, Power BI is taking an avg GP % of each sale and averaging those GP % against each other, so it shows for this customer in December 2016, that we had a GP % of 4%. However, if you add up all the GP for the month/Sales $, the GP % for the month of December 2016 for Pacific Foods SHOULD be -2%. I hope this is enough info to give me an idea how to set this up.
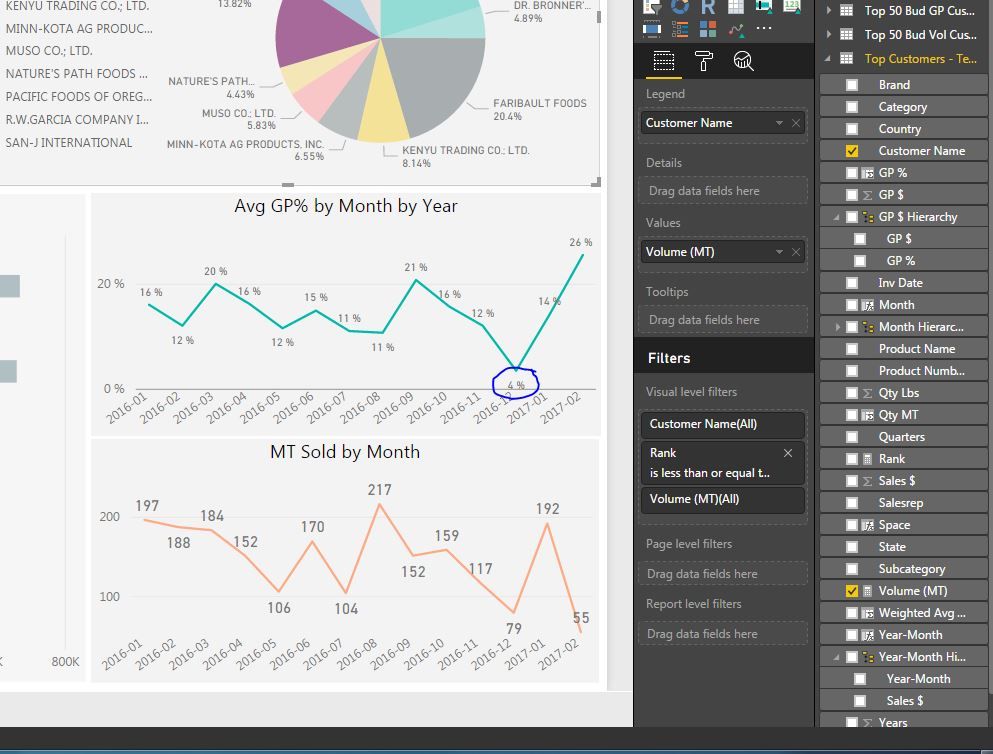 This is how it looks in Power BI
 Example of data which is pulled into Power BI


