Forum Discussion

pranit1997's avatar
pranit1997
Icon for Helper I rankHelper I
4 years ago

Waterfall Chart - with reverse totals

Need to some help around waterfall chart:
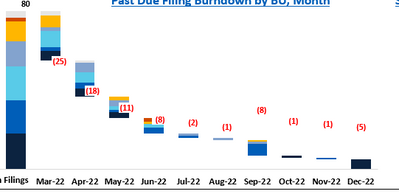
I need to create a Waterfall chart similar to the one shown below


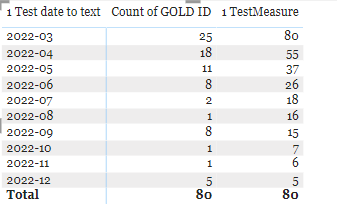
I have month vise count and reverse running total measures already created

I need to show the count dropping from 80 to 0


4 Replies

  • v-jinweili-msft's avatar
    v-jinweili-msft
    Icon for Microsoft Employee rankMicrosoft Employee

    Hi pranit1997 ,


    1. To simplify the data, I have used the summarized type of Sum to replace Count you used .And also I have reproduced your TestMeasure by using Sum instead of Count.


    TestMeasure =
    VAR _all =
        CALCULATE ( SUM ( 'Table'[GOLD ID] ), ALL ( 'Table' ) )
    VAR _pri =
        CALCULATE (
            SUM ( 'Table'[GOLD ID] ),
            FILTER (
                ALLSELECTED ( 'Table' ),
                'Table'[Test date to text] < MAX ( 'Table'[Test date to text] )
            )
        )
    RETURN
    _all - _pri
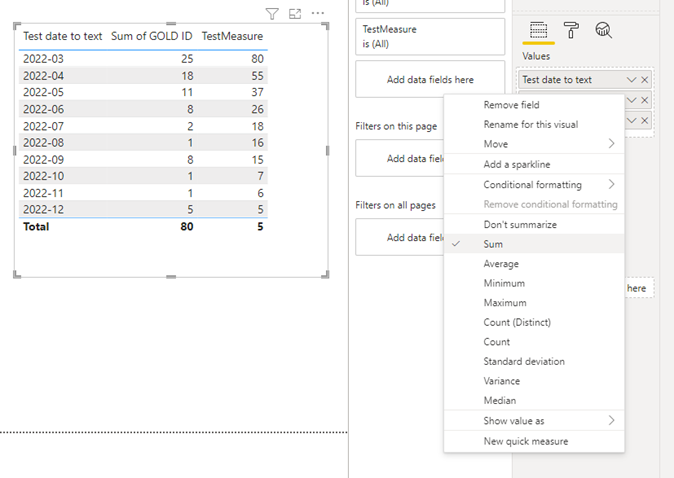


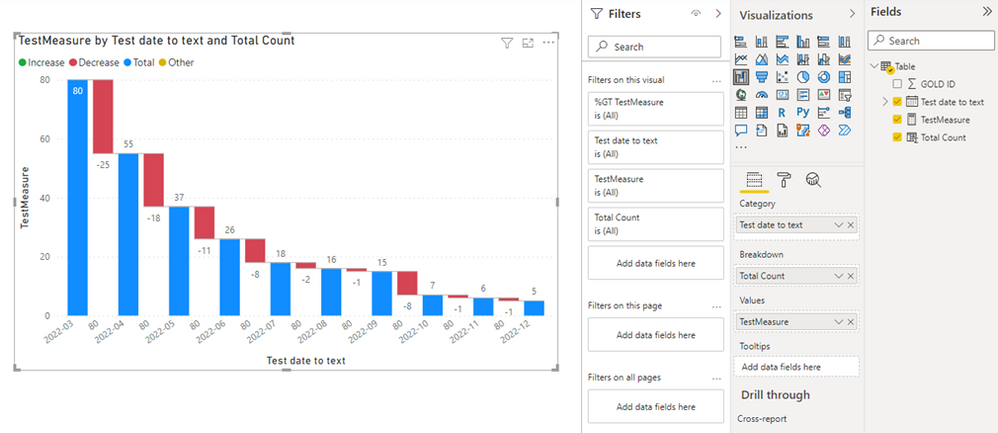
    2. Add a Total Count column for the Breakdown field in the Waterfall chart.


    Total Count = SUM ( 'Table'[GOLD ID] )


    Output:
     

    If it isn’t your expected output, please share more information (tables, outputs) to help us clarify your scenario. Or share me with your pbix file after removing sensitive data.


    Refer to:

    How to provide sample data in the Power BI Forum - Microsoft Power BI Community

    How to Get Your Question Answered Quickly - Microsoft Power BI Community


    Best Regards,
    Jinwei Li
    If this post helps, then please consider Accept it as the solution to help the other members find it more quickly.

    • pranit1997's avatar
      pranit1997
      Icon for Helper I rankHelper I

      Hey v-jinweili-msft 
      Thank you so much for taking out your time and helping me.

      I tried to reacreate the measure based on what you shared. But I am not getting the output table from 80 to 5.
      The ID field is string for me and it doesnt just contain numbers. 


      • pranit1997's avatar
        pranit1997
        Icon for Helper I rankHelper I

        I replaced the sum again with "CountA"
        I am getting the numbers right.
        Now, I have a column with status. When I am filtering those, its not affecting the count via this measure.
        Would there be way around that?

        Again thank you so much for helping me out