Forum Discussion
Trend based on slicer selection
Hey guys,
I'm trying to create a line chart that shows the data for the past few months based on the date I choose via slicer. Anyone know how I could achieve this? Thanks.
Anonymous,
You may take a look at the following post.
4 Replies
- AnonymousNot applicable
Anonymous are you trying something like this..
http://community.powerbi.com/t5/Desktop/Dynamic-date-x-axis/m-p/448578/highlight/false#M207597
- AnonymousNot applicable
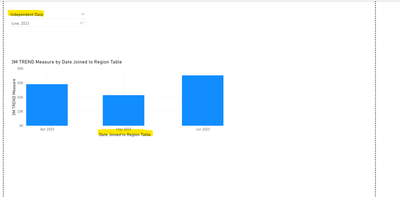
No what I meant was that I want the user to be able to select a certain week or month, and then the visual show data for that ranging from the selected month/week back to however many months back I select. i.e They select december (assume a year selection is made form another slicer) and see data from October-December. If they select June they see data from April-June.
Anonymous
- Chakravarthy
Resolver II
@Anonymous,
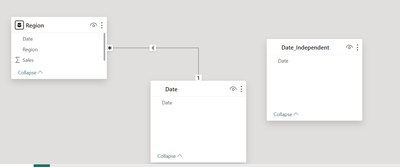
You need to create independent table as below
Create a measure:
3M TREND =VAR _MAX = MAX(Date_Independent[Date])VAR _MIN = EOMONTH(_MAX,-3)+1VAR _FILTER = FILTER('Date','Date'[Date]>=_MIN && 'Date'[Date]<=_MAX)VAR _RESULT = CALCULATE(SUM(Region[Sales]),_FILTER)RETURN _RESULT
- v-chuncz-msft
Community Support
Anonymous,
You may take a look at the following post.