FabCon is coming to Atlanta
Join us at FabCon Atlanta from March 16 - 20, 2026, for the ultimate Fabric, Power BI, AI and SQL community-led event. Save $200 with code FABCOMM.
Register now!- Power BI forums
- Get Help with Power BI
- Desktop
- Service
- Report Server
- Power Query
- Mobile Apps
- Developer
- DAX Commands and Tips
- Custom Visuals Development Discussion
- Health and Life Sciences
- Power BI Spanish forums
- Translated Spanish Desktop
- Training and Consulting
- Instructor Led Training
- Dashboard in a Day for Women, by Women
- Galleries
- Data Stories Gallery
- Themes Gallery
- Contests Gallery
- QuickViz Gallery
- Quick Measures Gallery
- Visual Calculations Gallery
- Notebook Gallery
- Translytical Task Flow Gallery
- TMDL Gallery
- R Script Showcase
- Webinars and Video Gallery
- Ideas
- Custom Visuals Ideas (read-only)
- Issues
- Issues
- Events
- Upcoming Events
The Power BI Data Visualization World Championships is back! Get ahead of the game and start preparing now! Learn more
- Power BI forums
- Forums
- Get Help with Power BI
- Desktop
- Re: Treemap - dynamic grouping question.
- Subscribe to RSS Feed
- Mark Topic as New
- Mark Topic as Read
- Float this Topic for Current User
- Bookmark
- Subscribe
- Printer Friendly Page


- Mark as New
- Bookmark
- Subscribe
- Mute
- Subscribe to RSS Feed
- Permalink
- Report Inappropriate Content
Treemap - dynamic grouping question.
Hi,
I have a treemap that has supplies category, each colored either green (if the sales for that supplies category is above 90%), or red (if the sales is below 90%). So, my treemap has bunch of greens and red squares.
What I want is an upper level view. Just 2 boxes red and green. When User clicks on red box, it will drill through and show the treemap of all the supplies category having sales >= 90% and when the user clicks on green box, it will drill through and show the treemap of all the supplies category having sales < 90%.
How would I go about it? The data being dynamic, it may be possible that all supplies category may fall into green or in red! I need a good headstart on how to go about creating upper level treemap. Any help is greatly appreciated. Thanks.
Prashant-


- Mark as New
- Bookmark
- Subscribe
- Mute
- Subscribe to RSS Feed
- Permalink
- Report Inappropriate Content
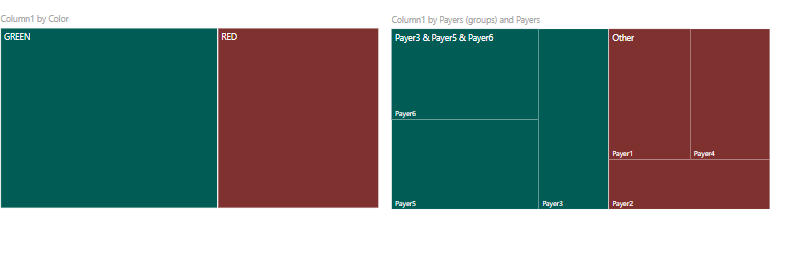
You can form two tree maps one acting as a slicer and the other reflecting changes and form groups by selecting the data and forming a calculated column to filter the records as green and red.
- Mark as New
- Bookmark
- Subscribe
- Mute
- Subscribe to RSS Feed
- Permalink
- Report Inappropriate Content
Hardik,
This is exactly what I am trying to do. I have a detailed treemap that you have shown. I want an upper level treemap done. How to achieve this?
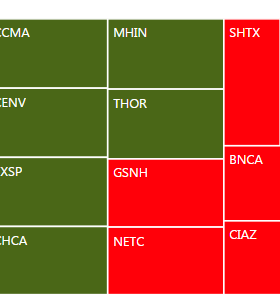
Please see the attached screenshot which shows the supplies categories marked in red and green. What I want is another treemap (which is upper level) which shows only red and green section which can be drilled down to get to the level that I have shown above. Does it call for grouping? You have demonstrated the outcome, I want to know how to achieve this. Sorry, I am very new to Power BI so detailed instructions will really help me a lot. Thanks.
Please note that everytime I fetch data from SQL Server DB, there may not be both green and red at upper level. if all the supplies category fall in 90% or above then the only square I will find would be green (red will be missing due to no supplies category falling in red zone).
- Mark as New
- Bookmark
- Subscribe
- Mute
- Subscribe to RSS Feed
- Permalink
- Report Inappropriate Content
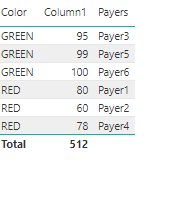
After that for the treemap visualisation,I have added these as columns
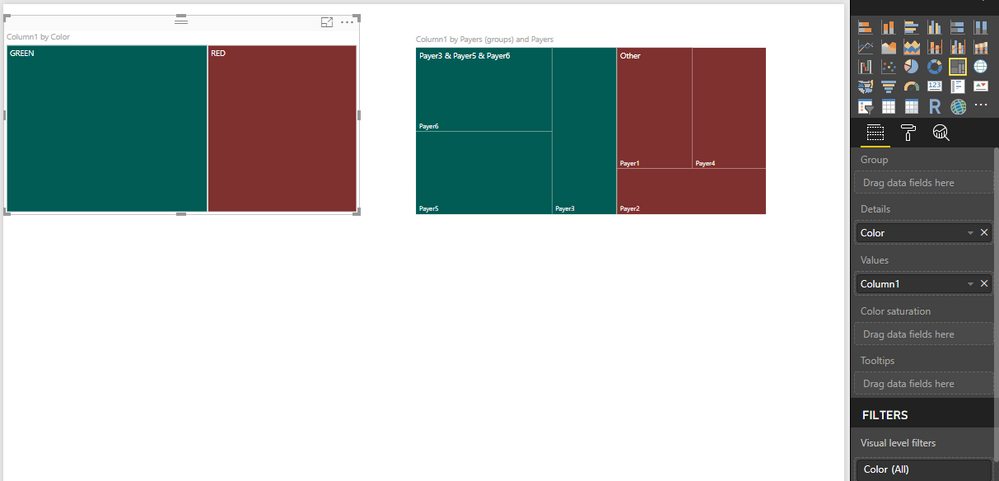
Then you can use the first tree map as the slicer to the second one according to your data.I hope this helps ! You are most welcome for any other query !
- Mark as New
- Bookmark
- Subscribe
- Mute
- Subscribe to RSS Feed
- Permalink
- Report Inappropriate Content
Thanks. It looks like I need more help. I am able to add the column color and assign it the values Green and Red using the DAX formula you have suggested.
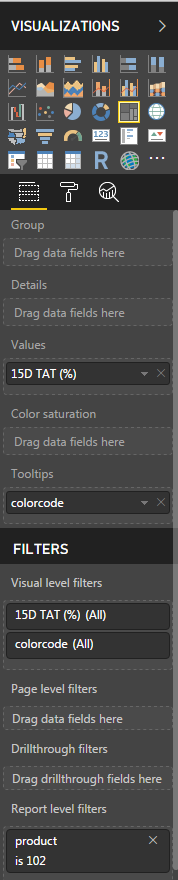
When I try to create a upper level treemap, when i click on column1 and color, for some reason the color goes directly into tooltip instead of details in the visualization. i am not able to drag it to put it on the details how you are showing. do you know why would that happen?
this is how my visualization comes out.
In my case, the 15D TAT % is a measure (equivalent to your column1 field). It is calculated based on the formula:
15D TAT (%) = CALCULATE(SUM(BaseQuery[Claims Processed with 15D TAT])/count(BaseQuery[ClaimSystemKey])*100)
Is there a way you can share your file with me to see what am i missing?
- Mark as New
- Bookmark
- Subscribe
- Mute
- Subscribe to RSS Feed
- Permalink
- Report Inappropriate Content
I tried creating a sample data that you have showed and it worked the way you have demonstrated. Unfortunately my case does not seem to be the same. Since the column1 that you have shown is a measure in my case, it is dependent on a qualifer (payor in this case) so as soon as i select it, i get to level2 of treemap directly since now the colors are shown based on payor.
I am very new to power bi so guessing at this time, but if the column1 would have been a calculated measure based on other fields, then would you still expect the same behavior that you have demonstrated? if so, then I am missing something. Hope we have a capability to share the pbix to show the issues. Thanks.
- Mark as New
- Bookmark
- Subscribe
- Mute
- Subscribe to RSS Feed
- Permalink
- Report Inappropriate Content
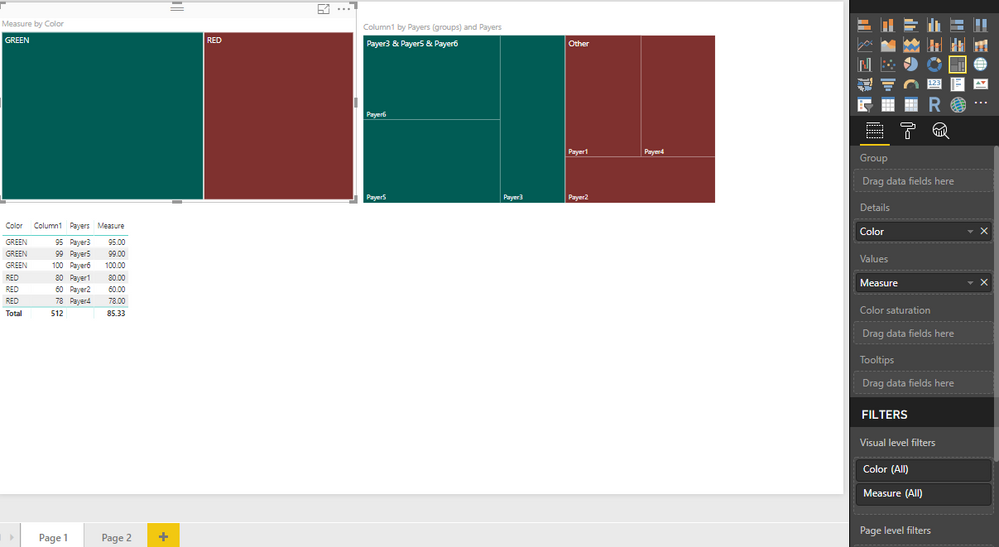
created a measure average and the treemap works fine on this side.
Measure = AVERAGE(Table1[Column1])
- Mark as New
- Bookmark
- Subscribe
- Mute
- Subscribe to RSS Feed
- Permalink
- Report Inappropriate Content
Is there a way to share .pbix file? If so, I can send you my file to have you show me what I am missing.
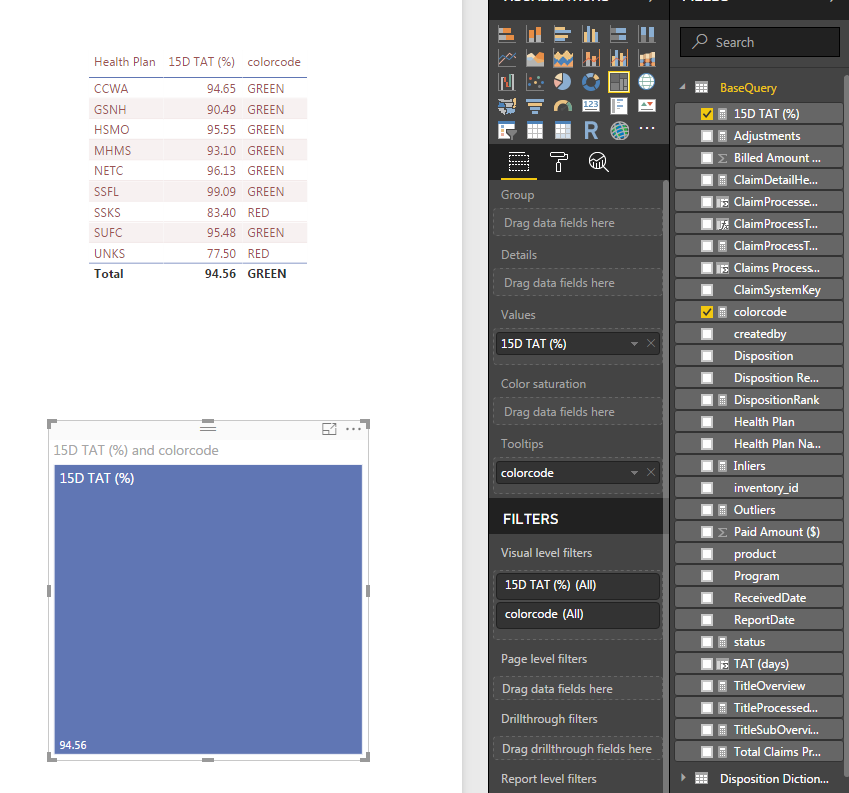
This is how my data in table format looks like in power bi. As you can see, the table format looks good. However when I try to create treemap with "15D TAT (%)" and colorcode selected, then the colorcode directly goes to tooltip and not in other visualization (e.g. values or details). As soon as select the Health Plan also in it, then I get the 2nd level treemap where each box represents the health plan.
I am stumped about what is missing.
- Mark as New
- Bookmark
- Subscribe
- Mute
- Subscribe to RSS Feed
- Permalink
- Report Inappropriate Content
- Mark as New
- Bookmark
- Subscribe
- Mute
- Subscribe to RSS Feed
- Permalink
- Report Inappropriate Content
Hi Hardik,
I had been exploring option to attach and send you the file. Unfortunately the onedrive, dropbox etc is blocked at my work place. So we will need to go to longer path. I am sending you the complete insert statements that I am running along with the calculation I am performing with screenshot. Hopefully you can recreate the problem at your end.
For creating table:
create table testtbl (healthplan varchar(20), claimkey varchar(20), receiveddt datetime, reportdate datetime)
--
INSERT into testtbl VALUES (N'ABC', N'111', CAST(N'2018-01-01 00:00:00.000' AS DateTime), CAST(N'2018-01-02 00:00:00.000' AS DateTime))
INSERT into testtbl VALUES (N'ABC', N'222', CAST(N'2018-01-01 00:00:00.000' AS DateTime), CAST(N'2018-01-10 00:00:00.000' AS DateTime))
INSERT into testtbl VALUES (N'ABC', N'333', CAST(N'2018-01-01 00:00:00.000' AS DateTime), CAST(N'2018-01-12 00:00:00.000' AS DateTime))
INSERT into testtbl VALUES (N'ABC', N'444', CAST(N'2018-01-01 00:00:00.000' AS DateTime), CAST(N'2018-01-13 00:00:00.000' AS DateTime))
INSERT into testtbl VALUES (N'DEF', N'555', CAST(N'2018-01-01 00:00:00.000' AS DateTime), CAST(N'2018-01-20 00:00:00.000' AS DateTime))
INSERT into testtbl VALUES (N'DEF', N'666', CAST(N'2018-01-01 00:00:00.000' AS DateTime), CAST(N'2018-01-10 00:00:00.000' AS DateTime))
INSERT into testtbl VALUES (N'DEF', N'777', CAST(N'2018-01-01 00:00:00.000' AS DateTime), CAST(N'2018-01-12 00:00:00.000' AS DateTime))
INSERT into testtbl VALUES (N'DEF', N'888', CAST(N'2018-01-01 00:00:00.000' AS DateTime), CAST(N'2018-01-13 00:00:00.000' AS DateTime))
INSERT into testtbl VALUES (N'GHI', N'999', CAST(N'2018-01-01 00:00:00.000' AS DateTime), CAST(N'2018-01-20 00:00:00.000' AS DateTime))
INSERT into testtbl VALUES (N'GHI', N'000', CAST(N'2018-01-01 00:00:00.000' AS DateTime), CAST(N'2018-01-30 00:00:00.000' AS DateTime))
INSERT into testtbl VALUES (N'GHI', N'123', CAST(N'2018-01-01 00:00:00.000' AS DateTime), CAST(N'2018-01-12 00:00:00.000' AS DateTime))
INSERT into testtbl VALUES (N'GHI', N'234', CAST(N'2018-01-01 00:00:00.000' AS DateTime), CAST(N'2018-01-13 00:00:00.000' AS DateTime))
INSERT into testtbl VALUES (N'JKL', N'345', CAST(N'2018-01-01 00:00:00.000' AS DateTime), CAST(N'2018-01-02 00:00:00.000' AS DateTime))
INSERT into testtbl VALUES (N'JKL', N'456', CAST(N'2018-01-01 00:00:00.000' AS DateTime), CAST(N'2018-01-02 00:00:00.000' AS DateTime))
INSERT into testtbl VALUES (N'JKL', N'567', CAST(N'2018-01-01 00:00:00.000' AS DateTime), CAST(N'2018-01-02 00:00:00.000' AS DateTime))
INSERT into testtbl VALUES (N'JKL', N'678', CAST(N'2018-01-01 00:00:00.000' AS DateTime), CAST(N'2018-01-02 00:00:00.000' AS DateTime))
INSERT into testtbl VALUES (N'JKL', N'131', CAST(N'2018-01-01 00:00:00.000' AS DateTime), CAST(N'2018-01-02 00:00:00.000' AS DateTime))
INSERT into testtbl VALUES (N'JKL', N'132', CAST(N'2018-01-01 00:00:00.000' AS DateTime), CAST(N'2018-01-02 00:00:00.000' AS DateTime))
INSERT into testtbl VALUES (N'JKL', N'133', CAST(N'2018-01-01 00:00:00.000' AS DateTime), CAST(N'2018-01-02 00:00:00.000' AS DateTime))
INSERT into testtbl VALUES (N'JKL', N'134', CAST(N'2018-01-01 00:00:00.000' AS DateTime), CAST(N'2018-01-02 00:00:00.000' AS DateTime))
INSERT into testtbl VALUES (N'JKL', N'135', CAST(N'2018-01-01 00:00:00.000' AS DateTime), CAST(N'2018-01-02 00:00:00.000' AS DateTime))
INSERT into testtbl VALUES (N'JKL', N'136', CAST(N'2018-01-01 00:00:00.000' AS DateTime), CAST(N'2018-01-02 00:00:00.000' AS DateTime))
INSERT into testtbl VALUES (N'JKL', N'137', CAST(N'2018-01-01 00:00:00.000' AS DateTime), CAST(N'2018-01-02 00:00:00.000' AS DateTime))
INSERT into testtbl VALUES (N'JKL', N'138', CAST(N'2018-01-01 00:00:00.000' AS DateTime), CAST(N'2018-01-02 00:00:00.000' AS DateTime))
INSERT into testtbl VALUES (N'JKL', N'146', CAST(N'2018-01-01 00:00:00.000' AS DateTime), CAST(N'2018-01-20 00:00:00.000' AS DateTime))
INSERT into testtbl VALUES (N'JKL', N'147', CAST(N'2018-01-01 00:00:00.000' AS DateTime), CAST(N'2018-01-20 00:00:00.000' AS DateTime))
INSERT into testtbl VALUES (N'JKL', N'139', CAST(N'2018-01-01 00:00:00.000' AS DateTime), CAST(N'2018-01-02 00:00:00.000' AS DateTime))
INSERT into testtbl VALUES (N'JKL', N'140', CAST(N'2018-01-01 00:00:00.000' AS DateTime), CAST(N'2018-01-02 00:00:00.000' AS DateTime))
INSERT into testtbl VALUES (N'JKL', N'141', CAST(N'2018-01-01 00:00:00.000' AS DateTime), CAST(N'2018-01-02 00:00:00.000' AS DateTime))
INSERT into testtbl VALUES (N'JKL', N'142', CAST(N'2018-01-01 00:00:00.000' AS DateTime), CAST(N'2018-01-02 00:00:00.000' AS DateTime))
INSERT into testtbl VALUES (N'JKL', N'143', CAST(N'2018-01-01 00:00:00.000' AS DateTime), CAST(N'2018-01-02 00:00:00.000' AS DateTime))
INSERT into testtbl VALUES (N'JKL', N'144', CAST(N'2018-01-01 00:00:00.000' AS DateTime), CAST(N'2018-01-02 00:00:00.000' AS DateTime))
INSERT into testtbl VALUES (N'JKL', N'145', CAST(N'2018-01-01 00:00:00.000' AS DateTime), CAST(N'2018-01-02 00:00:00.000' AS DateTime))
INSERT into testtbl VALUES (N'MNO', N'124', CAST(N'2018-01-01 00:00:00.000' AS DateTime), CAST(N'2018-01-20 00:00:00.000' AS DateTime))
INSERT into testtbl VALUES (N'MNO', N'125', CAST(N'2018-01-01 00:00:00.000' AS DateTime), CAST(N'2018-01-30 00:00:00.000' AS DateTime))
INSERT into testtbl VALUES (N'MNO', N'126', CAST(N'2018-01-01 00:00:00.000' AS DateTime), CAST(N'2018-01-25 00:00:00.000' AS DateTime))
INSERT into testtbl VALUES (N'MNO', N'127', CAST(N'2018-01-01 00:00:00.000' AS DateTime), CAST(N'2018-01-02 00:00:00.000' AS DateTime))
--
- Mark as New
- Bookmark
- Subscribe
- Mute
- Subscribe to RSS Feed
- Permalink
- Report Inappropriate Content
This link says there is no functionality to attach the file. We need to use dropbox or onedrive etc to share the content. Don't know how to go about it.
- Mark as New
- Bookmark
- Subscribe
- Mute
- Subscribe to RSS Feed
- Permalink
- Report Inappropriate Content
Hello Hardik,
Sorry for the late response. Onedrive and dropbox are blocked at my workplace, I had been trying to get around it but it seems there is no option for sharing the file.
So we will need to go longer route. I am sending you all the details to reproduce the problem.
Please create table as below.
create table testtbl (healthplan varchar(20), claimkey varchar(20), receiveddt datetime, reportdate datetime)
INSERT into testtbl VALUES ('ABC', '111', ('2018-01-01'), ('2018-01-02'))
INSERT into testtbl VALUES ('ABC', '222', ('2018-01-01'), ('2018-01-10'))
INSERT into testtbl VALUES ('ABC', '333', ('2018-01-01'), ('2018-01-12'))
INSERT into testtbl VALUES ('ABC', '444', ('2018-01-01'), ('2018-01-13'))
INSERT into testtbl VALUES ('DEF', '555', ('2018-01-01'), ('2018-01-20'))
INSERT into testtbl VALUES ('DEF', '666', ('2018-01-01'), ('2018-01-10'))
INSERT into testtbl VALUES ('DEF', '777', ('2018-01-01'), ('2018-01-12'))
INSERT into testtbl VALUES ('DEF', '888', ('2018-01-01'), ('2018-01-13'))
INSERT into testtbl VALUES ('GHI', '999', ('2018-01-01'), ('2018-01-20'))
INSERT into testtbl VALUES ('GHI', '000', ('2018-01-01'), ('2018-01-30'))
INSERT into testtbl VALUES ('GHI', '123', ('2018-01-01'), ('2018-01-12'))
INSERT into testtbl VALUES ('GHI', '234', ('2018-01-01'), ('2018-01-13'))
INSERT into testtbl VALUES ('JKL', '345', ('2018-01-01'), ('2018-01-02'))
INSERT into testtbl VALUES ('JKL', '456', ('2018-01-01'), ('2018-01-02'))
INSERT into testtbl VALUES ('JKL', '567', ('2018-01-01'), ('2018-01-02'))
INSERT into testtbl VALUES ('JKL', '678', ('2018-01-01'), ('2018-01-02'))
INSERT into testtbl VALUES ('JKL', '131', ('2018-01-01'), ('2018-01-02'))
INSERT into testtbl VALUES ('JKL', '132', ('2018-01-01'), ('2018-01-02'))
INSERT into testtbl VALUES ('JKL', '133', ('2018-01-01'), ('2018-01-02'))
INSERT into testtbl VALUES ('JKL', '134', ('2018-01-01'), ('2018-01-02'))
INSERT into testtbl VALUES ('JKL', '135', ('2018-01-01'), ('2018-01-02'))
INSERT into testtbl VALUES ('JKL', '136', ('2018-01-01'), ('2018-01-02'))
INSERT into testtbl VALUES ('JKL', '137', ('2018-01-01'), ('2018-01-02'))
INSERT into testtbl VALUES ('JKL', '138', ('2018-01-01'), ('2018-01-02'))
INSERT into testtbl VALUES ('JKL', '146', ('2018-01-01'), ('2018-01-20'))
INSERT into testtbl VALUES ('JKL', '147', ('2018-01-01'), ('2018-01-20'))
INSERT into testtbl VALUES ('JKL', '139', ('2018-01-01'), ('2018-01-02'))
INSERT into testtbl VALUES ('JKL', '140', ('2018-01-01'), ('2018-01-02'))
INSERT into testtbl VALUES ('JKL', '141', ('2018-01-01'), ('2018-01-02'))
INSERT into testtbl VALUES ('JKL', '142', ('2018-01-01'), ('2018-01-02'))
INSERT into testtbl VALUES ('JKL', '143', ('2018-01-01'), ('2018-01-02'))
INSERT into testtbl VALUES ('JKL', '144', ('2018-01-01'), ('2018-01-02'))
INSERT into testtbl VALUES ('JKL', '145', ('2018-01-01'), ('2018-01-02'))
INSERT into testtbl VALUES ('MNO', '124', ('2018-01-01'), ('2018-01-20'))
INSERT into testtbl VALUES ('MNO', '125', ('2018-01-01'), ('2018-01-30'))
INSERT into testtbl VALUES ('MNO', '126', ('2018-01-01'), ('2018-01-25'))
INSERT into testtbl VALUES ('MNO', '127', ('2018-01-01'), ('2018-01-02'))
- Mark as New
- Bookmark
- Subscribe
- Mute
- Subscribe to RSS Feed
- Permalink
- Report Inappropriate Content
Once you create the table as requested earlier,
Please select entire table into powerbi query. Now, create 2 New columns as:
TAT = datediff(Testtbl[receiveddt].[Date], Testtbl[reportdate].[Date], day)
15DTAT = if(Testtbl[TAT] < 15, 1, 0)
Create New Measure as:
15DTAT% = CALCULATE(SUM(Testtbl[15DTAT])/count(Testtbl[claimkey])*100)
In the treemap, select:
healthplan, color and 15DTAT%. This will show you every healthplan with its corresponding 15DTAT% value.
What I am looking for is:
In a treemap only 2 blocks - Green and Red. Green represents # of Healthplans having 15DTAT% >= 90. Red represents # of Healthplans having 15DTAT% < 90.
In this case, the healthplan ABC has 100% and JKL 90.48% and hence Green color would be for 2 healthplans. DEF, GHI and MNO has < 90% and hence Red color would be for 3 healthplans.
At my end, it appears as below: 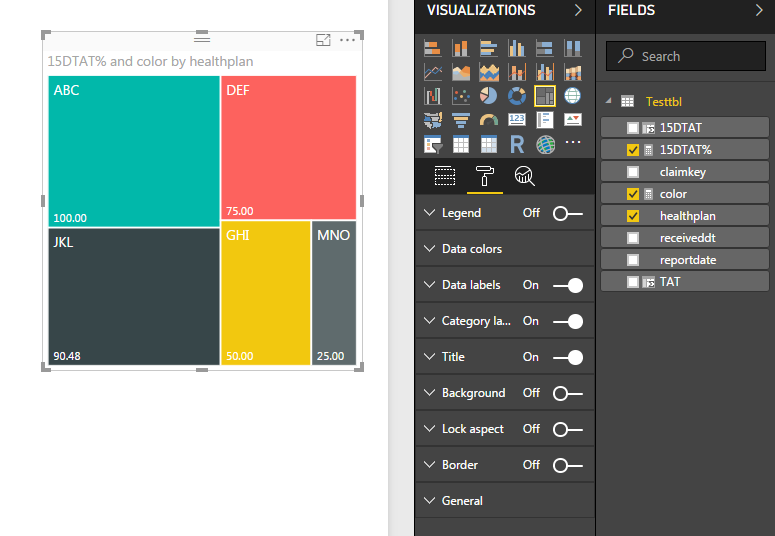
- Mark as New
- Bookmark
- Subscribe
- Mute
- Subscribe to RSS Feed
- Permalink
- Report Inappropriate Content
Hello Hardik,
Were you able to reproduce the problem? Please let me know. Thanks.
- Mark as New
- Bookmark
- Subscribe
- Mute
- Subscribe to RSS Feed
- Permalink
- Report Inappropriate Content
Hello Hardik,
Sorry for the delayed response. Unfortunately Ondrive and Dropbox are blocked at my workplace. I had been trying to get around it. so we will need to go to longer path. I am sending you all the necessary info to recreate the problem.
create table testtbl (healthplan varchar(20), claimkey varchar(20), receiveddt datetime, reportdate datetime)
INSERT into testtbl VALUES (N'ABC', N'111', CAST(N'2018-01-01 00:00:00.000' AS DateTime), CAST(N'2018-01-02 00:00:00.000' AS DateTime))
INSERT into testtbl VALUES (N'ABC', N'222', CAST(N'2018-01-01 00:00:00.000' AS DateTime), CAST(N'2018-01-10 00:00:00.000' AS DateTime))
INSERT into testtbl VALUES (N'ABC', N'333', CAST(N'2018-01-01 00:00:00.000' AS DateTime), CAST(N'2018-01-12 00:00:00.000' AS DateTime))
INSERT into testtbl VALUES (N'ABC', N'444', CAST(N'2018-01-01 00:00:00.000' AS DateTime), CAST(N'2018-01-13 00:00:00.000' AS DateTime))
INSERT into testtbl VALUES (N'DEF', N'555', CAST(N'2018-01-01 00:00:00.000' AS DateTime), CAST(N'2018-01-20 00:00:00.000' AS DateTime))
INSERT into testtbl VALUES (N'DEF', N'666', CAST(N'2018-01-01 00:00:00.000' AS DateTime), CAST(N'2018-01-10 00:00:00.000' AS DateTime))
INSERT into testtbl VALUES (N'DEF', N'777', CAST(N'2018-01-01 00:00:00.000' AS DateTime), CAST(N'2018-01-12 00:00:00.000' AS DateTime))
INSERT into testtbl VALUES (N'DEF', N'888', CAST(N'2018-01-01 00:00:00.000' AS DateTime), CAST(N'2018-01-13 00:00:00.000' AS DateTime))
INSERT into testtbl VALUES (N'GHI', N'999', CAST(N'2018-01-01 00:00:00.000' AS DateTime), CAST(N'2018-01-20 00:00:00.000' AS DateTime))
INSERT into testtbl VALUES (N'GHI', N'000', CAST(N'2018-01-01 00:00:00.000' AS DateTime), CAST(N'2018-01-30 00:00:00.000' AS DateTime))
INSERT into testtbl VALUES (N'GHI', N'123', CAST(N'2018-01-01 00:00:00.000' AS DateTime), CAST(N'2018-01-12 00:00:00.000' AS DateTime))
INSERT into testtbl VALUES (N'GHI', N'234', CAST(N'2018-01-01 00:00:00.000' AS DateTime), CAST(N'2018-01-13 00:00:00.000' AS DateTime))
INSERT into testtbl VALUES (N'JKL', N'345', CAST(N'2018-01-01 00:00:00.000' AS DateTime), CAST(N'2018-01-02 00:00:00.000' AS DateTime))
INSERT into testtbl VALUES (N'JKL', N'456', CAST(N'2018-01-01 00:00:00.000' AS DateTime), CAST(N'2018-01-02 00:00:00.000' AS DateTime))
INSERT into testtbl VALUES (N'JKL', N'567', CAST(N'2018-01-01 00:00:00.000' AS DateTime), CAST(N'2018-01-02 00:00:00.000' AS DateTime))
INSERT into testtbl VALUES (N'JKL', N'678', CAST(N'2018-01-01 00:00:00.000' AS DateTime), CAST(N'2018-01-02 00:00:00.000' AS DateTime))
INSERT into testtbl VALUES (N'JKL', N'131', CAST(N'2018-01-01 00:00:00.000' AS DateTime), CAST(N'2018-01-02 00:00:00.000' AS DateTime))
INSERT into testtbl VALUES (N'JKL', N'132', CAST(N'2018-01-01 00:00:00.000' AS DateTime), CAST(N'2018-01-02 00:00:00.000' AS DateTime))
INSERT into testtbl VALUES (N'JKL', N'133', CAST(N'2018-01-01 00:00:00.000' AS DateTime), CAST(N'2018-01-02 00:00:00.000' AS DateTime))
INSERT into testtbl VALUES (N'JKL', N'134', CAST(N'2018-01-01 00:00:00.000' AS DateTime), CAST(N'2018-01-02 00:00:00.000' AS DateTime))
INSERT into testtbl VALUES (N'JKL', N'135', CAST(N'2018-01-01 00:00:00.000' AS DateTime), CAST(N'2018-01-02 00:00:00.000' AS DateTime))
INSERT into testtbl VALUES (N'JKL', N'136', CAST(N'2018-01-01 00:00:00.000' AS DateTime), CAST(N'2018-01-02 00:00:00.000' AS DateTime))
INSERT into testtbl VALUES (N'JKL', N'137', CAST(N'2018-01-01 00:00:00.000' AS DateTime), CAST(N'2018-01-02 00:00:00.000' AS DateTime))
INSERT into testtbl VALUES (N'JKL', N'138', CAST(N'2018-01-01 00:00:00.000' AS DateTime), CAST(N'2018-01-02 00:00:00.000' AS DateTime))
INSERT into testtbl VALUES (N'JKL', N'146', CAST(N'2018-01-01 00:00:00.000' AS DateTime), CAST(N'2018-01-20 00:00:00.000' AS DateTime))
INSERT into testtbl VALUES (N'JKL', N'147', CAST(N'2018-01-01 00:00:00.000' AS DateTime), CAST(N'2018-01-20 00:00:00.000' AS DateTime))
INSERT into testtbl VALUES (N'JKL', N'139', CAST(N'2018-01-01 00:00:00.000' AS DateTime), CAST(N'2018-01-02 00:00:00.000' AS DateTime))
INSERT into testtbl VALUES (N'JKL', N'140', CAST(N'2018-01-01 00:00:00.000' AS DateTime), CAST(N'2018-01-02 00:00:00.000' AS DateTime))
INSERT into testtbl VALUES (N'JKL', N'141', CAST(N'2018-01-01 00:00:00.000' AS DateTime), CAST(N'2018-01-02 00:00:00.000' AS DateTime))
INSERT into testtbl VALUES (N'JKL', N'142', CAST(N'2018-01-01 00:00:00.000' AS DateTime), CAST(N'2018-01-02 00:00:00.000' AS DateTime))
INSERT into testtbl VALUES (N'JKL', N'143', CAST(N'2018-01-01 00:00:00.000' AS DateTime), CAST(N'2018-01-02 00:00:00.000' AS DateTime))
INSERT into testtbl VALUES (N'JKL', N'144', CAST(N'2018-01-01 00:00:00.000' AS DateTime), CAST(N'2018-01-02 00:00:00.000' AS DateTime))
INSERT into testtbl VALUES (N'JKL', N'145', CAST(N'2018-01-01 00:00:00.000' AS DateTime), CAST(N'2018-01-02 00:00:00.000' AS DateTime))
INSERT into testtbl VALUES (N'MNO', N'124', CAST(N'2018-01-01 00:00:00.000' AS DateTime), CAST(N'2018-01-20 00:00:00.000' AS DateTime))
INSERT into testtbl VALUES (N'MNO', N'125', CAST(N'2018-01-01 00:00:00.000' AS DateTime), CAST(N'2018-01-30 00:00:00.000' AS DateTime))
INSERT into testtbl VALUES (N'MNO', N'126', CAST(N'2018-01-01 00:00:00.000' AS DateTime), CAST(N'2018-01-25 00:00:00.000' AS DateTime))
INSERT into testtbl VALUES (N'MNO', N'127', CAST(N'2018-01-01 00:00:00.000' AS DateTime), CAST(N'2018-01-02 00:00:00.000' AS DateTime))
- Mark as New
- Bookmark
- Subscribe
- Mute
- Subscribe to RSS Feed
- Permalink
- Report Inappropriate Content
Also, how to find out the number of green boxes and red boxes in the 2nd level treemap that I have? In the example I have shown previously, there are 6 green boxes and 5 red boxes. Is there a way to numerically demonstrate them?


- Mark as New
- Bookmark
- Subscribe
- Mute
- Subscribe to RSS Feed
- Permalink
- Report Inappropriate Content
Hi @ppgandhi11
You can add a calculated column to your table that dynamically determines if the value should be red or green.
This will only be dynamic based on data coming into the model and filters will not have any effect.

Helpful resources

Power BI Dataviz World Championships
The Power BI Data Visualization World Championships is back! Get ahead of the game and start preparing now!

Power BI Monthly Update - November 2025
Check out the November 2025 Power BI update to learn about new features.

FabCon Atlanta 2026
Join us at FabCon Atlanta, March 16-20, for the ultimate Fabric, Power BI, AI and SQL community-led event. Save $200 with code FABCOMM.

| User | Count |
|---|---|
| 66 | |
| 46 | |
| 42 | |
| 26 | |
| 19 |


| User | Count |
|---|---|
| 196 | |
| 127 | |
| 102 | |
| 67 | |
| 49 |


