- Power BI forums
- Updates
- News & Announcements
- Get Help with Power BI
- Desktop
- Service
- Report Server
- Power Query
- Mobile Apps
- Developer
- DAX Commands and Tips
- Custom Visuals Development Discussion
- Health and Life Sciences
- Power BI Spanish forums
- Translated Spanish Desktop
- Power Platform Integration - Better Together!
- Power Platform Integrations (Read-only)
- Power Platform and Dynamics 365 Integrations (Read-only)
- Training and Consulting
- Instructor Led Training
- Dashboard in a Day for Women, by Women
- Galleries
- Community Connections & How-To Videos
- COVID-19 Data Stories Gallery
- Themes Gallery
- Data Stories Gallery
- R Script Showcase
- Webinars and Video Gallery
- Quick Measures Gallery
- 2021 MSBizAppsSummit Gallery
- 2020 MSBizAppsSummit Gallery
- 2019 MSBizAppsSummit Gallery
- Events
- Ideas
- Custom Visuals Ideas
- Issues
- Issues
- Events
- Upcoming Events
- Community Blog
- Power BI Community Blog
- Custom Visuals Community Blog
- Community Support
- Community Accounts & Registration
- Using the Community
- Community Feedback
Register now to learn Fabric in free live sessions led by the best Microsoft experts. From Apr 16 to May 9, in English and Spanish.
- Power BI forums
- Forums
- Get Help with Power BI
- Desktop
- Re: Total column layout unexpected
- Subscribe to RSS Feed
- Mark Topic as New
- Mark Topic as Read
- Float this Topic for Current User
- Bookmark
- Subscribe
- Printer Friendly Page
- Mark as New
- Bookmark
- Subscribe
- Mute
- Subscribe to RSS Feed
- Permalink
- Report Inappropriate Content
Total column layout unexpected
Hi,guys!
I'm a new for PowerBI,having a solution,almost 3 days thinking with it,and that make me crazy.
Please give me some suggestion with below:
A matrix,
row: shop_item
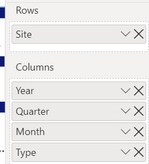
column: Year、Quartar、Month、type
value: Order、Unit、Revenue (All are the measure with sum)
I want to show data in the quarter which the user select,and need to compare another quarter the user also selected.
so,I have two Calendar filter like this
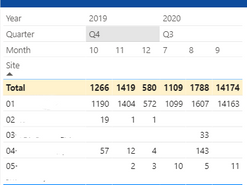
and my matrix like this
Because I need to compare with two quarters,I need the total value with 3 months.
I have tried many ways to put the total column like this
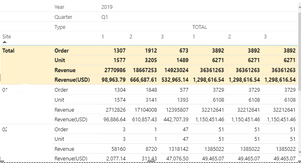
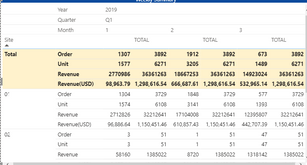
column subtotal is no work,and i use a custom table to switch the value,the layout will be change like this
the value measure code like this
Test thisQMaxMonth_Order1 =
var _thisQMaxMonth = MAX(DIM_Calendar[Month])
VAR _YQ0 = SELECTEDVALUE('DIM_Calendar'[Year])*100 + (4-SELECTEDVALUE('DIM_Calendar'[QuarterOrder]))
VAR _YQ1 = SELECTEDVALUE('DIM_Calendar (2)'[Year])*100 + (4-SELECTEDVALUE('DIM_Calendar (2)'[QuarterOrder]))
VAR _VALUE1 = CALCULATE([#Order],FILTER('DIM_Calendar (2)'
    ,'DIM_Calendar (2)'[Month] = _thisQMaxMonth)
    ,USERELATIONSHIP('DIM_Calendar (2)'[Date], 'FACT_Sales'[Order_Creation_Date]), ALL('DIM_Calendar'))
var _totalvalue1 = CALCULATE([#Order]
    ,USERELATIONSHIP('DIM_Calendar (2)'[Date], 'FACT_Sales'[Order_Creation_Date]), ALL('DIM_Calendar'))

return
SWITCH( SELECTEDVALUE('Type'[Type])
    ,"", SWITCH(_YQ0, _YQ1, _VALUE1)
    ,"total", SWITCH(_YQ0, _YQ1, _totalvalue1)
    )
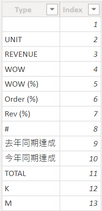
Finally,I try to create a table including month(1-12 + total ) or Quarter(Q1-Q4 + total),but still no work...
I really no ideal How to do this in one matrix!
Could someone give me a suggestion,i will appreciate that.
- Mark as New
- Bookmark
- Subscribe
- Mute
- Subscribe to RSS Feed
- Permalink
- Report Inappropriate Content
Hi @JosephWu ,
Could you pls share your pbix file ,remember to remove confidential data.
Best Regards
Lucien
Helpful resources

Microsoft Fabric Learn Together
Covering the world! 9:00-10:30 AM Sydney, 4:00-5:30 PM CET (Paris/Berlin), 7:00-8:30 PM Mexico City

Power BI Monthly Update - April 2024
Check out the April 2024 Power BI update to learn about new features.

| User | Count |
|---|---|
| 108 | |
| 98 | |
| 78 | |
| 66 | |
| 53 |
| User | Count |
|---|---|
| 139 | |
| 100 | |
| 95 | |
| 85 | |
| 63 |
