Forum Discussion
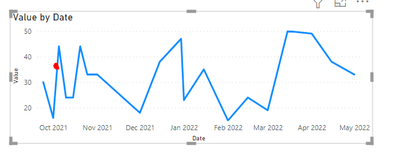
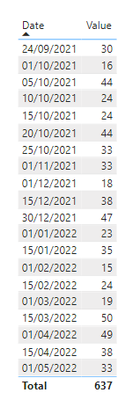
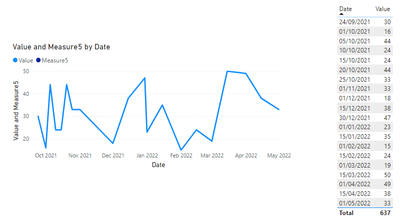
Today value on line graph
- 4 years ago
Hi, Anonymous
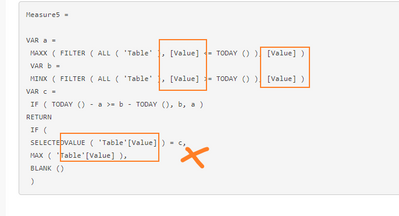
I am back. The code in my sample is no problem. But you modified it wrong when you used it.
I used your sample, and modify it.
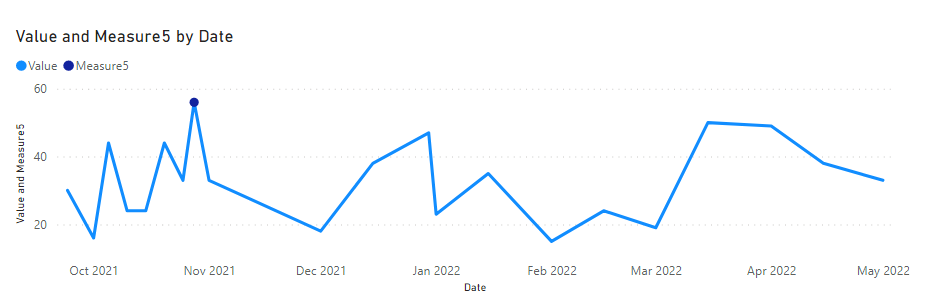
Try this:
Measure5 = VAR a = MAXX ( FILTER ( ALL ( 'Table' ), [Date] <= TODAY () ), [Date] ) VAR b = MINX ( FILTER ( ALL ( 'Table' ), [Date] >= TODAY () ), [Date] ) VAR c = IF ( TODAY () - a >= b - TODAY (), b, a ) RETURN IF ( SELECTEDVALUE ( 'Table'[Date] ) = c, SELECTEDVALUE ( ( 'Table'[Value] ), BLANK () ) )Did I answer your question ? Please mark my reply as solution. Thank you very much.
If not, please upload some insensitive data samples and expected output.
Best Regards,Community Support Team _ Janey
Anonymous , Create a second measure and plot that
measure 2= calculate(sum(Table[Value]), filter(Table, Table[Date]=Today())
or create bar and do condition formatting using this measure
if(max(Table[date]= Today(), "Red","blue")
or
if(max(Table[date]= Today(), "Red", blank() )
use that in conditional formatting using field value option and then convert bar to line
How to do conditional formatting by measure and apply it on pie?: https://youtu.be/RqBb5eBf_I4