FabCon is coming to Atlanta
Join us at FabCon Atlanta from March 16 - 20, 2026, for the ultimate Fabric, Power BI, AI and SQL community-led event. Save $200 with code FABCOMM.
Register now!- Power BI forums
- Get Help with Power BI
- Desktop
- Service
- Report Server
- Power Query
- Mobile Apps
- Developer
- DAX Commands and Tips
- Custom Visuals Development Discussion
- Health and Life Sciences
- Power BI Spanish forums
- Translated Spanish Desktop
- Training and Consulting
- Instructor Led Training
- Dashboard in a Day for Women, by Women
- Galleries
- Data Stories Gallery
- Themes Gallery
- Contests Gallery
- QuickViz Gallery
- Quick Measures Gallery
- Visual Calculations Gallery
- Notebook Gallery
- Translytical Task Flow Gallery
- TMDL Gallery
- R Script Showcase
- Webinars and Video Gallery
- Ideas
- Custom Visuals Ideas (read-only)
- Issues
- Issues
- Events
- Upcoming Events
The Power BI Data Visualization World Championships is back! Get ahead of the game and start preparing now! Learn more
- Power BI forums
- Forums
- Get Help with Power BI
- Desktop
- Re: Time Diff between Times in the Same Column
- Subscribe to RSS Feed
- Mark Topic as New
- Mark Topic as Read
- Float this Topic for Current User
- Bookmark
- Subscribe
- Printer Friendly Page

- Mark as New
- Bookmark
- Subscribe
- Mute
- Subscribe to RSS Feed
- Permalink
- Report Inappropriate Content
Time Diff between Times in the Same Column
Hi,
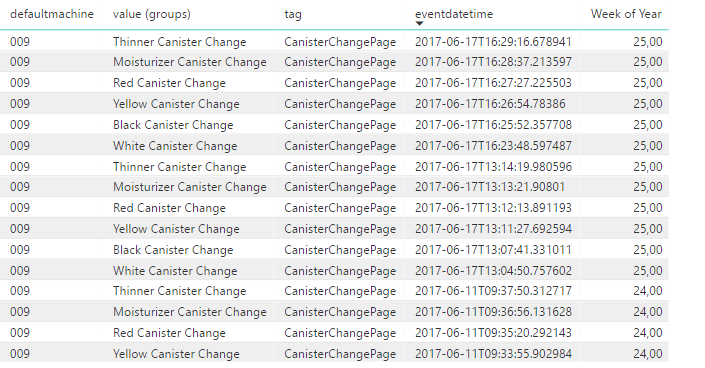
I am trying to find the average time between each type of canister change within this table. I am running into some trouble because the dates are in the same column so I cannot just use DATEDIFF between two columns to compute the time. The canister values do not have unique codes either so I am not sure how to go about this. Please let me know if you have any suggestions or solutions.
Thanks.
Solved! Go to Solution.


- Mark as New
- Bookmark
- Subscribe
- Mute
- Subscribe to RSS Feed
- Permalink
- Report Inappropriate Content
Hi @harshali,
Based on my understanding, you should be able to simply use the formula below to create a measure to calculate the Time Diff, then show the measure with defaultmachine, Canister Type Change, and Type column on the Table visual in your scenario.
Measure = DATEDIFF ( MIN ( Table1[eventdatetime] ), MAX ( Table1[eventdatetime] ), DAY )
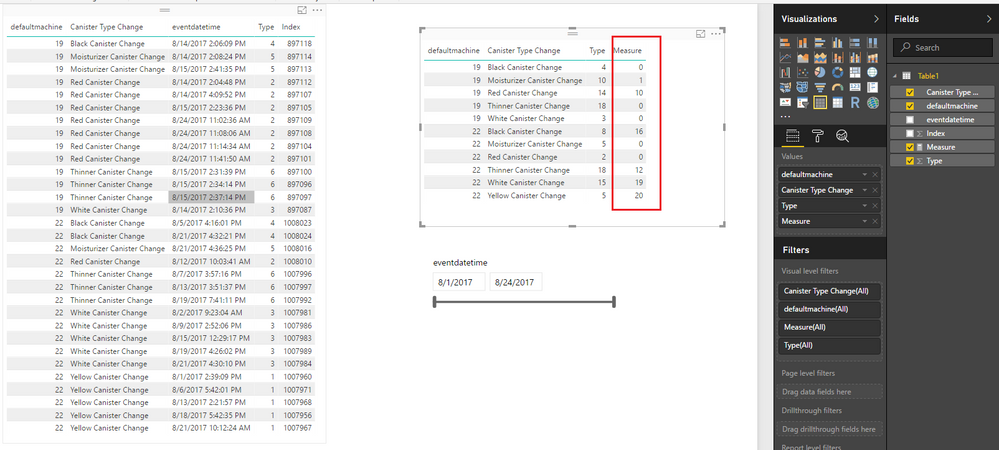
I know you will feel confused about the solution. So please think about the formula below. 
(A - B) + (B - C) + (C - D) = A - D
Hopefully it could help in your scenario.
Regards
- Mark as New
- Bookmark
- Subscribe
- Mute
- Subscribe to RSS Feed
- Permalink
- Report Inappropriate Content
Hi @harshali,
What's your expected result against the sample data above? Could you be more precisely with the logic for calculation here?
In addition, it's better to paste the sample data instead of posting a screenshot, so that we can easily use it for testing.
Regards
- Mark as New
- Bookmark
- Subscribe
- Mute
- Subscribe to RSS Feed
- Permalink
- Report Inappropriate Content
Hi @v-ljerr-msft,
Sorry about that. My ideal result would be the time difference between rows, based on the same Type and Index number. I have also pasted the data below for your convenience. Thanks for your advice.
| defaultmachine | Canister Type Change | eventdatetime | Index | Type | Week of Year |
| 16 | Yellow Canister Change | 2017-05-16T10:21:08.874143 | 1 | 1 | 21 |
| 16 | Yellow Canister Change | 2017-06-11T10:19:26.219861 | 2 | 1 | 24 |
| 16 | White Canister Change | 2017-06-11T10:17:47.969449 | 3 | 3 | 24 |
| 16 | White Canister Change | 2017-08-25T13:06:55.639283 | 4 | 3 | 35 |
| 16 | White Canister Change | 2017-05-16T10:18:26.854676 | 5 | 3 | 21 |
| 16 | Thinner Canister Change | 2017-05-16T10:23:00.467694 | 6 | 6 | 21 |
| 16 | Thinner Canister Change | 2017-06-11T10:20:59.799339 | 7 | 6 | 24 |
| 16 | Thinner Canister Change | 2017-08-25T13:00:45.456448 | 8 | 6 | 35 |
| 16 | Red Canister Change | 2017-06-11T10:19:47.215559 | 9 | 2 | 24 |
| 16 | Red Canister Change | 2017-05-16T10:21:33.900915 | 10 | 2 | 21 |
| 16 | Red Canister Change | 2017-08-25T13:12:25.556772 | 11 | 2 | 35 |
| 16 | Moisturizer Canister Change | 2017-08-25T13:18:36.474456 | 12 | 5 | 35 |
| 16 | Moisturizer Canister Change | 2017-05-16T10:21:58.935576 | 13 | 5 | 21 |


- Mark as New
- Bookmark
- Subscribe
- Mute
- Subscribe to RSS Feed
- Permalink
- Report Inappropriate Content
Can we get more data? Will multiple DefaultMachine numbers be possible, and will Index number continue over DefaultMachines or reset for each DefaultMachine?
Please give Kudos or Mark as a Solution!
https://www.linkedin.com/in/forrest-hill-04480730/
Proud to give back to the community!
Thank You!
- Mark as New
- Bookmark
- Subscribe
- Mute
- Subscribe to RSS Feed
- Permalink
- Report Inappropriate Content
Looks like the index numbers are not coming out consecutively as I had expected, but yes they continue over machine numbers. And there are multiple machine numbers as well. Also the unit of time of time that is produced is the number of days, correct?
Here is some more data that will hopefully help. Thanks again.
| defaultmachine | Canister Type Change | eventdatetime | Type | Index |
| 19 | Red Canister Change | 2017-08-24T11:41:50.536442 | 2 | 897101 |
| 19 | Red Canister Change | 2017-08-24T11:14:34.767856 | 2 | 897104 |
| 19 | Red Canister Change | 2017-08-24T11:08:06.70435 | 2 | 897108 |
| 19 | Red Canister Change | 2017-08-24T11:02:36.410795 | 2 | 897109 |
| 22 | Moisturizer Canister Change | 2017-08-21T16:36:25.754018 | 5 | 1008016 |
| 22 | Black Canister Change | 2017-08-21T16:32:21.265534 | 4 | 1008024 |
| 22 | White Canister Change | 2017-08-21T16:30:10.199489 | 3 | 1007984 |
| 22 | Yellow Canister Change | 2017-08-21T10:12:24.651155 | 1 | 1007967 |
| 22 | Thinner Canister Change | 2017-08-19T19:41:11.766304 | 6 | 1007992 |
| 22 | White Canister Change | 2017-08-19T16:26:02.059086 | 3 | 1007989 |
| 22 | Yellow Canister Change | 2017-08-18T17:42:35.506395 | 1 | 1007956 |
| 19 | Moisturizer Canister Change | 2017-08-15T14:41:35.408575 | 5 | 897113 |
| 19 | Thinner Canister Change | 2017-08-15T14:37:14.480917 | 6 | 897097 |
| 19 | Thinner Canister Change | 2017-08-15T14:34:14.441171 | 6 | 897096 |
| 19 | Thinner Canister Change | 2017-08-15T14:31:39.508281 | 6 | 897100 |
| 19 | Red Canister Change | 2017-08-15T14:23:36.123432 | 2 | 897105 |
| 22 | White Canister Change | 2017-08-15T12:29:17.292659 | 3 | 1007983 |
| 19 | Red Canister Change | 2017-08-14T16:09:52.640378 | 2 | 897107 |
| 19 | White Canister Change | 2017-08-14T14:10:36.358276 | 3 | 897087 |
| 19 | Moisturizer Canister Change | 2017-08-14T14:08:24.085631 | 5 | 897114 |
| 19 | Black Canister Change | 2017-08-14T14:06:09.444854 | 4 | 897118 |
| 19 | Red Canister Change | 2017-08-14T14:04:48.989088 | 2 | 897112 |
| 22 | Thinner Canister Change | 2017-08-13T15:51:37.801959 | 6 | 1007997 |
| 22 | Yellow Canister Change | 2017-08-13T14:21:57.865524 | 1 | 1007968 |
| 22 | Red Canister Change | 2017-08-12T10:03:41.946071 | 2 | 1008010 |
| 22 | White Canister Change | 2017-08-09T14:52:06.352583 | 3 | 1007986 |
| 22 | Thinner Canister Change | 2017-08-07T15:57:16.960034 | 6 | 1007996 |
| 22 | Yellow Canister Change | 2017-08-06T17:42:01.53673 | 1 | 1007971 |
| 22 | Black Canister Change | 2017-08-05T16:16:01.899794 | 4 | 1008023 |
| 22 | White Canister Change | 2017-08-02T09:23:04.430831 | 3 | 1007981 |
| 22 | Yellow Canister Change | 2017-08-01T14:39:09.391816 | 1 | 1007960 |
- Mark as New
- Bookmark
- Subscribe
- Mute
- Subscribe to RSS Feed
- Permalink
- Report Inappropriate Content
Hi @harshali,
Based on my understanding, you should be able to simply use the formula below to create a measure to calculate the Time Diff, then show the measure with defaultmachine, Canister Type Change, and Type column on the Table visual in your scenario.
Measure = DATEDIFF ( MIN ( Table1[eventdatetime] ), MAX ( Table1[eventdatetime] ), DAY )
I know you will feel confused about the solution. So please think about the formula below.
(A - B) + (B - C) + (C - D) = A - D
Hopefully it could help in your scenario.
Regards
- Mark as New
- Bookmark
- Subscribe
- Mute
- Subscribe to RSS Feed
- Permalink
- Report Inappropriate Content
Hi,
Thank you for your help! This exact formula did not work for me as it was giving me zeros for all measure results, but I modified it by dividing the entire formula by a COUNTROWS of the table, and this ended up giving me accurate measurements.
- Mark as New
- Bookmark
- Subscribe
- Mute
- Subscribe to RSS Feed
- Permalink
- Report Inappropriate Content
I've floated this issue in hopes someone else will try, I can't seem to get the code working with the multiple variables... FOrrest
Please give Kudos or Mark as a Solution!
https://www.linkedin.com/in/forrest-hill-04480730/
Proud to give back to the community!
Thank You!
- Mark as New
- Bookmark
- Subscribe
- Mute
- Subscribe to RSS Feed
- Permalink
- Report Inappropriate Content
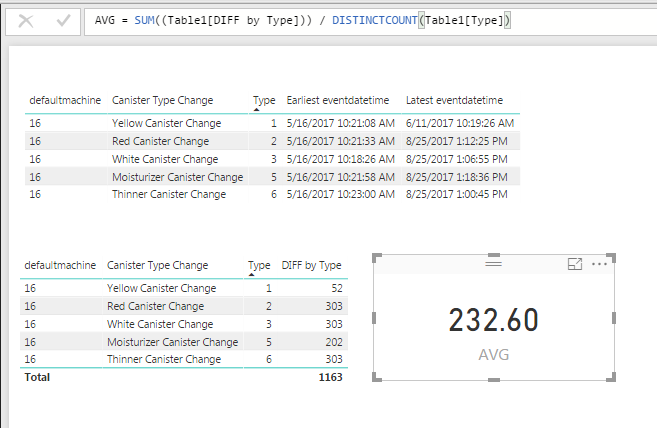
When it comes to Dates & Times, 'Average' is a term with multiple meanings. I read your reuqest asking for 'How many Days on Average does each canister last?) Here's a Calcualted Column (not a measure) to help you find the DATEDIFF between the MIN and MAX values. I then 'Average' by summing the DATEDIFF days and dividing by the UniqueCount of all Types...
Thoughts? P.S. Your raw data is in the format your provided... My data screen shot on top just breaks things up into EARLIEST and LATEST so I could do a gut check on my DATEDIFF values.
DIFF by Type = CALCULATE( DATEDIFF(MIN(Table1[eventdatetime]),MAX(Table1[eventdatetime]),DAY), FILTER(Table1, Table1[Type] = EARLIER(Table1[Type])))
Please give Kudos or Mark as a Solution!
https://www.linkedin.com/in/forrest-hill-04480730/
Proud to give back to the community!
Thank You!
- Mark as New
- Bookmark
- Subscribe
- Mute
- Subscribe to RSS Feed
- Permalink
- Report Inappropriate Content
Isn't this only providing the duration between the oldest and most recent change though? For example, for the White Canister change, I noticed it took the difference between 5/16 and 8/25 rather than 6/11 and 8/25 which would be the most recent change and the second most recent change. Ideally I would like for it to take the difference like this-- between the most recent and second most recent, not most recent and oldest.
- Mark as New
- Bookmark
- Subscribe
- Mute
- Subscribe to RSS Feed
- Permalink
- Report Inappropriate Content
I am going to test this now. But how did you remove the T in the eventdatetime column?
- Mark as New
- Bookmark
- Subscribe
- Mute
- Subscribe to RSS Feed
- Permalink
- Report Inappropriate Content
Power BI automaticlaly converted that to a Date Time Column for me...? Not sure if this is a USA formatting thing, as I've seen the "T" allot but never experienced it in my data personally.
Please give Kudos or Mark as a Solution!
https://www.linkedin.com/in/forrest-hill-04480730/
Proud to give back to the community!
Thank You!

Helpful resources

Power BI Dataviz World Championships
The Power BI Data Visualization World Championships is back! Get ahead of the game and start preparing now!

Power BI Monthly Update - December 2025
Check out the December 2025 Power BI Holiday Recap!

FabCon Atlanta 2026
Join us at FabCon Atlanta, March 16-20, for the ultimate Fabric, Power BI, AI and SQL community-led event. Save $200 with code FABCOMM.

| User | Count |
|---|---|
| 38 | |
| 37 | |
| 33 | |
| 32 | |
| 29 |


| User | Count |
|---|---|
| 132 | |
| 88 | |
| 82 | |
| 68 | |
| 64 |


