Join us at FabCon Vienna from September 15-18, 2025
The ultimate Fabric, Power BI, SQL, and AI community-led learning event. Save €200 with code FABCOMM.
Get registered- Power BI forums
- Get Help with Power BI
- Desktop
- Service
- Report Server
- Power Query
- Mobile Apps
- Developer
- DAX Commands and Tips
- Custom Visuals Development Discussion
- Health and Life Sciences
- Power BI Spanish forums
- Translated Spanish Desktop
- Training and Consulting
- Instructor Led Training
- Dashboard in a Day for Women, by Women
- Galleries
- Data Stories Gallery
- Themes Gallery
- Contests Gallery
- Quick Measures Gallery
- Notebook Gallery
- Translytical Task Flow Gallery
- TMDL Gallery
- R Script Showcase
- Webinars and Video Gallery
- Ideas
- Custom Visuals Ideas (read-only)
- Issues
- Issues
- Events
- Upcoming Events
Enhance your career with this limited time 50% discount on Fabric and Power BI exams. Ends September 15. Request your voucher.
- Power BI forums
- Forums
- Get Help with Power BI
- Desktop
- Re: Subtotal is not correct (sum up ) in matrix
- Subscribe to RSS Feed
- Mark Topic as New
- Mark Topic as Read
- Float this Topic for Current User
- Bookmark
- Subscribe
- Printer Friendly Page

- Mark as New
- Bookmark
- Subscribe
- Mute
- Subscribe to RSS Feed
- Permalink
- Report Inappropriate Content
Subtotal is not correct (sum up ) in matrix
Hi
Somehow the matrix (column) is not sum up correctly, it shows the average value or something.

Thank you in advanced for your help.
Best regards,
Jenny
- Mark as New
- Bookmark
- Subscribe
- Mute
- Subscribe to RSS Feed
- Permalink
- Report Inappropriate Content
Hi
The described problem could not be solved.
The matrix cannot sum up correctly for "total weekly"

No DAX used. Just the simply funtion from PowerBI (count distinct)

The question is why it does not sum up.
I have a feeling that it counts distinct instead of summing up.
If it is doing so....how can I make it summing up?
Best regards,
Jenny


- Mark as New
- Bookmark
- Subscribe
- Mute
- Subscribe to RSS Feed
- Permalink
- Report Inappropriate Content
Hi @tranje ,
Does it display properly after the change? Also what is the value shown for total weekly? What is the corresponding measure formula for it?
Looking forward to your feedback.
Best Regards,
Henry
- Mark as New
- Bookmark
- Subscribe
- Mute
- Subscribe to RSS Feed
- Permalink
- Report Inappropriate Content
As you can see in the picture (The "Total weekly" is not sum up correctly).
Actually, I did not use any DAX, I used the count distinct. What I did change is the formatting.
All the configuration for formatting you can see in the answer I gave to the others.


- Mark as New
- Bookmark
- Subscribe
- Mute
- Subscribe to RSS Feed
- Permalink
- Report Inappropriate Content
- Mark as New
- Bookmark
- Subscribe
- Mute
- Subscribe to RSS Feed
- Permalink
- Report Inappropriate Content
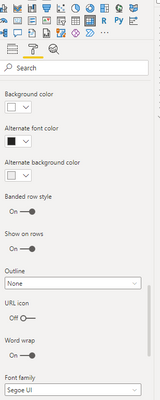
The total number of tests is based on powerbi distinct count

What I changed:
Subtotal is showing on the top and it has a band row style

- Mark as New
- Bookmark
- Subscribe
- Mute
- Subscribe to RSS Feed
- Permalink
- Report Inappropriate Content
share your Dax please
Did I answer your question? If so, please mark my post as a solution!
Proud to be a Super User!
- Mark as New
- Bookmark
- Subscribe
- Mute
- Subscribe to RSS Feed
- Permalink
- Report Inappropriate Content
The total number of tests is based on powerbi distinct count
What I changed:
Subtotal is showing on the top and it has a band row style

Helpful resources

Power BI Monthly Update - August 2025
Check out the August 2025 Power BI update to learn about new features.

Fabric Community Update - August 2025
Find out what's new and trending in the Fabric community.

| User | Count |
|---|---|
| 68 | |
| 63 | |
| 59 | |
| 54 | |
| 28 |


| User | Count |
|---|---|
| 181 | |
| 82 | |
| 66 | |
| 47 | |
| 44 |


