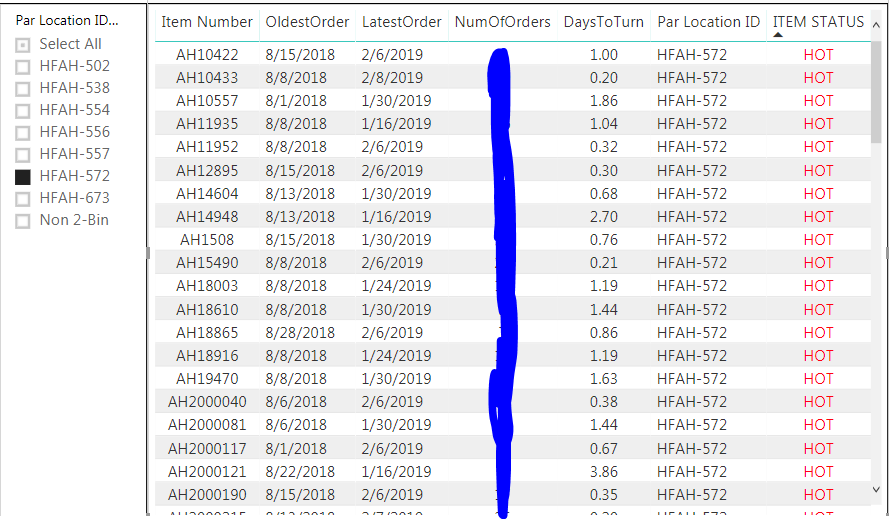
I am trying to create a 100% stacked column based off the results of the measure below: I have created a DistinctCount measure to give me a count of items per Par Location ID(screenshot below). I have tried doing some Calculate/Countrow variations, but I think I'm missing a piece of the puzzle to bring everything together. Would I need to create separate measures for each of these 5 outputs in order to create a stacked bar chart? Currently it just shows the chart as 100% "HOT," and doesn't factor in the other 4 values.
ITEM STATUS =
IF('2_Bin_Query'[DelPerWeek] = 0, "STALE",
IF('2_Bin_Query'[DaysToTurn] = 0, "SLOW",
IF( '2_Bin_Query'[DaysToTurn] <= [HotSpinCalc],
"HOT",
IF([DaysToTurn] >=[ColdSpinCalc],
"COLD",
"OPTIMAL"
))))
The table below is used to monitor inventory usage/levels at various locations. I want the stacked column to show percentage of Hot, Cold, Optimal, Stale, Slow.
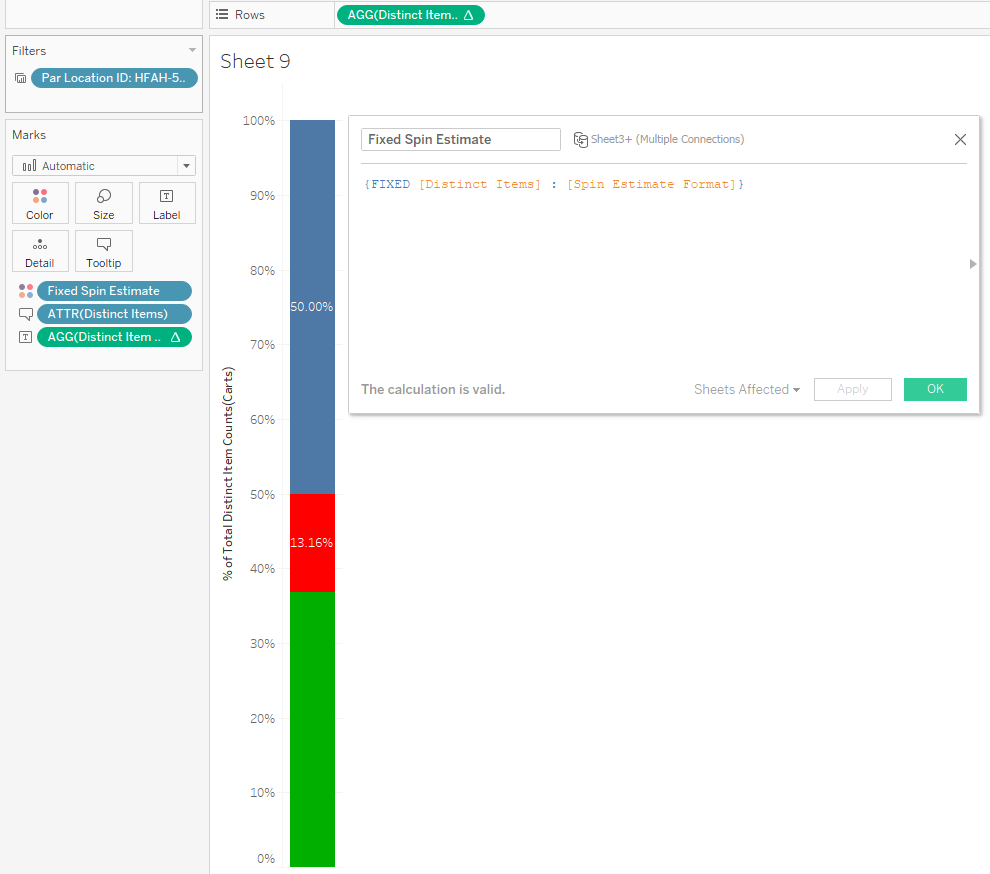
I was able to do this in Tableau by getting a distinct count of items and colorizing a simple Fixed LOD expression.