Join us at FabCon Vienna from September 15-18, 2025
The ultimate Fabric, Power BI, SQL, and AI community-led learning event. Save €200 with code FABCOMM.
Get registered- Power BI forums
- Get Help with Power BI
- Desktop
- Service
- Report Server
- Power Query
- Mobile Apps
- Developer
- DAX Commands and Tips
- Custom Visuals Development Discussion
- Health and Life Sciences
- Power BI Spanish forums
- Translated Spanish Desktop
- Training and Consulting
- Instructor Led Training
- Dashboard in a Day for Women, by Women
- Galleries
- Data Stories Gallery
- Themes Gallery
- Contests Gallery
- Quick Measures Gallery
- Notebook Gallery
- Translytical Task Flow Gallery
- TMDL Gallery
- R Script Showcase
- Webinars and Video Gallery
- Ideas
- Custom Visuals Ideas (read-only)
- Issues
- Issues
- Events
- Upcoming Events
Compete to become Power BI Data Viz World Champion! First round ends August 18th. Get started.
- Power BI forums
- Forums
- Get Help with Power BI
- Desktop
- Re: Sorting dates into quarters from different yea...
- Subscribe to RSS Feed
- Mark Topic as New
- Mark Topic as Read
- Float this Topic for Current User
- Bookmark
- Subscribe
- Printer Friendly Page

- Mark as New
- Bookmark
- Subscribe
- Mute
- Subscribe to RSS Feed
- Permalink
- Report Inappropriate Content
Sorting dates into quarters from different years
Hello I am having issues sorting my data from different quarters in a chronological order.
For example I want to sort data from Q3-2018 to Q1-2019. So the data should line up Q3-18, Q4-18, Q1-19, but it is not (see picture). It is also consolidating Q4 data from both 2018 and 2019 into the same Q4 column.
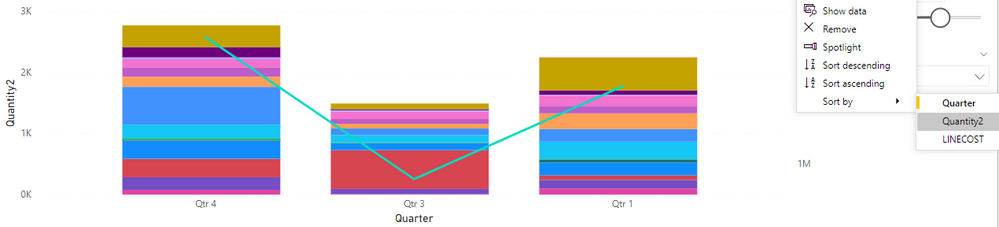
Also, I have verified that the data is being recognized as Date/Time in the table.

Any help on this? Thanks
Solved! Go to Solution.


- Mark as New
- Bookmark
- Subscribe
- Mute
- Subscribe to RSS Feed
- Permalink
- Report Inappropriate Content
hi, @Anonymous
Please refer to this screenshot:
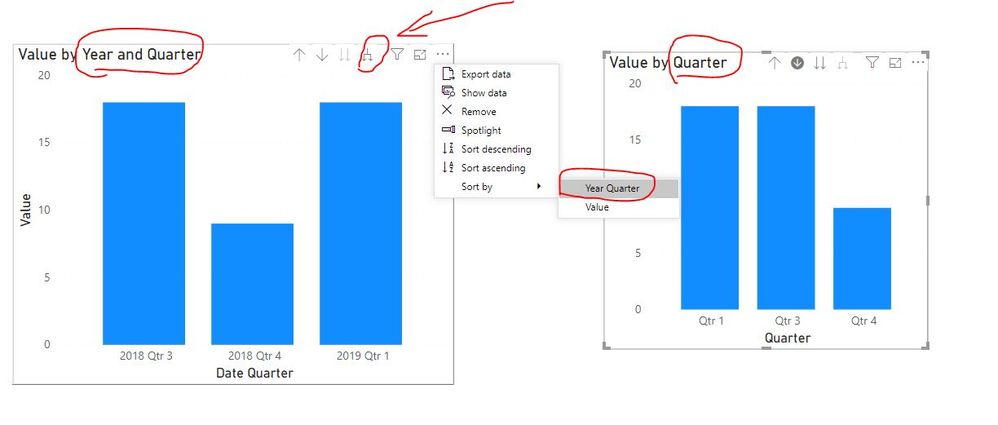
You have to keep Year hierarchy in the visual too, otherwise, it will be aggregated in quarter hierarchy.
"however, drill down does not fix my problem.", Do not use drill down, you should use expand.
and here is a simple sample pbix file, please try it.
Best Regards,
Lin
If this post helps, then please consider Accept it as the solution to help the other members find it more quickly.
- Mark as New
- Bookmark
- Subscribe
- Mute
- Subscribe to RSS Feed
- Permalink
- Report Inappropriate Content
hi, @Anonymous
For your case, you just need to learn the difference Drill pathways in drill model.
https://docs.microsoft.com/en-us/power-bi/consumer/end-user-drill#drill-pathways
From your screenshot, we could know that you used drill down for the date column, that will only get the next level data.
For example, when you drill down on Year level, you will only get quarter level.
So different year value will be aggregated for the same quarter.
You should use Expand in drill model
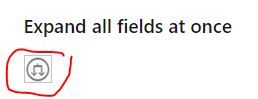
For example, when you expand on Year level, you will get Year-Quertar, and it will sort by correct way.
Regards,
Lin
If this post helps, then please consider Accept it as the solution to help the other members find it more quickly.
- Mark as New
- Bookmark
- Subscribe
- Mute
- Subscribe to RSS Feed
- Permalink
- Report Inappropriate Content
Hello Lin,
Thanks for your suggestion, however, drill down does not fix my problem. I do have drill down enabled and even with the date hierarchy, PBI is not recognizing the year difference among the quarters. Like I mentioned above, my data timestamps are from Q3-2018 to Q1-2019, but PBI will only sort the quarter numerically instead of chronologically 4-3-1 or 1-3-4(see first picture). I need it to recognize that Q3 and Q4 are of the previous year and Q1 of the later year.
Robyn
- Mark as New
- Bookmark
- Subscribe
- Mute
- Subscribe to RSS Feed
- Permalink
- Report Inappropriate Content
hi, @Anonymous
Please refer to this screenshot:
You have to keep Year hierarchy in the visual too, otherwise, it will be aggregated in quarter hierarchy.
"however, drill down does not fix my problem.", Do not use drill down, you should use expand.
and here is a simple sample pbix file, please try it.
Best Regards,
Lin
If this post helps, then please consider Accept it as the solution to help the other members find it more quickly.
- Mark as New
- Bookmark
- Subscribe
- Mute
- Subscribe to RSS Feed
- Permalink
- Report Inappropriate Content
What a silly mistake. Thanks for explaining this, though it took a few knocks on my noggin. It works (for now)! Thanks again for your help Lin. 🙂
Robyn
- Mark as New
- Bookmark
- Subscribe
- Mute
- Subscribe to RSS Feed
- Permalink
- Report Inappropriate Content
Hi,
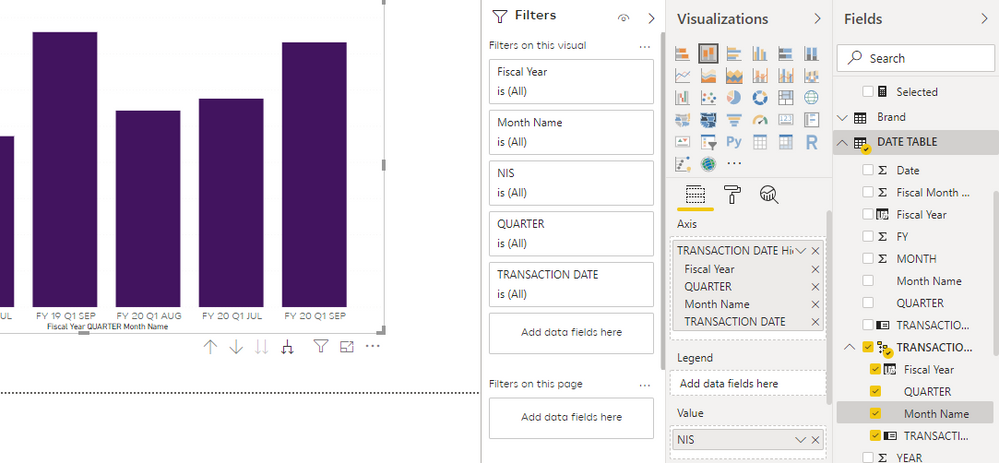
My suggestion would be to always use a date table. It's a table you save somewhere on your desktop and always use in every report. In the table, you'll have each quarter mapped to a year and Power BI will recognise it as a hierarchy, so when you use it as a field you can put year and underneath quarter, which will solve your issue.
Here's how it looks for me in a simple visual:
You can easily download a ready made date table from many sources, here's one: https://www.sqlbi.com/tools/dax-date-template/
Hope this helps!
Eva
- Mark as New
- Bookmark
- Subscribe
- Mute
- Subscribe to RSS Feed
- Permalink
- Report Inappropriate Content
Hello Eva. Thanks for the suggestion.
Would this table only apply to once off data? This data will be streaming from an Azure Server, so I cannot simply copy information into a nicely structured table.
Robyn
- Mark as New
- Bookmark
- Subscribe
- Mute
- Subscribe to RSS Feed
- Permalink
- Report Inappropriate Content
Hi,
The date table stays forever. It just has every date you could ever need (mine runs from 2005 to 2025) and maps it to a month, a quarter, a year, whatever you need.
You just import it every time you create a Power BI report which uses dates, and create a relationship between the date table and the column in your database that has your dates.
Eva
- Mark as New
- Bookmark
- Subscribe
- Mute
- Subscribe to RSS Feed
- Permalink
- Report Inappropriate Content
Hello Eva,
I apologize as I am new to DAX tables. Do I import this file as a new visualization? When I try to import, PBI looks for visual files (*.pbiviz) however, this file downloads as a .pbit and .pbix. I'm a little confused how to import this into my existing .pbix visual dashboard. If you could break it down into steps, I'd appreciate it. Thanks!
Robyn
- Mark as New
- Bookmark
- Subscribe
- Mute
- Subscribe to RSS Feed
- Permalink
- Report Inappropriate Content
Hi!
You're just importing it as a data source, not as a visual (in 'Get Data'- Power BI database). Think of it as another part of your data- it's just a mapping table.
Then, to create the relationship, have a look at: https://docs.microsoft.com/en-us/power-bi/desktop-create-and-manage-relationships
Best,
Eva
- Mark as New
- Bookmark
- Subscribe
- Mute
- Subscribe to RSS Feed
- Permalink
- Report Inappropriate Content
Hello again Eva,
I've attached a screenshot of the list that populates from my "Get Data" tab. I do not see Power BI database - ony datasets and dataflows.
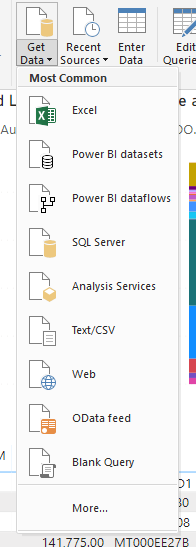
I tried to connect to datasets but it says I cannot connect to it and another data source at the same time. Can you clarify? Thanks.
Robyn
Helpful resources

Power BI Monthly Update - August 2025
Check out the August 2025 Power BI update to learn about new features.

Fabric Community Update - August 2025
Find out what's new and trending in the Fabric community.


| User | Count |
|---|---|
| 84 | |
| 71 | |
| 68 | |
| 64 | |
| 45 |


