Forum Discussion

Sorting by Month as Text (Jan Feb Mar etc)
Hi
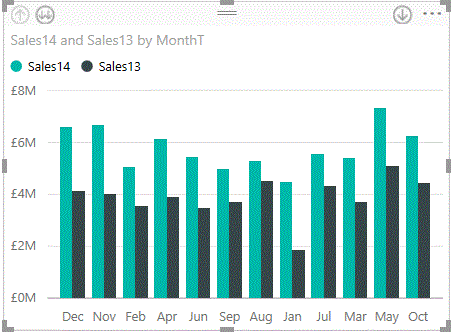
I can sort the slicer by month as shown on this thread. (its confusing but at least i can do this)
but not for this graph. Is there a way to do this?
This is straight forward with other solution I have used. Qlik for example store month (InvDate) as a combined text and number so can be sorted either by number or alpha
Thanks
OK got it
https://support.powerbi.com/knowledgebase/articles/592116
Go to data (left hand side button) and click
Then go to the table to be sorted (right hand side)
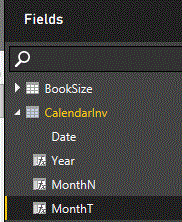
You will need three columns in this calendar table for month
create
1 Main column (to set up the link column for Invoice Date)
CalendarInv = CALENDAR (MINX(Header, Header[Invoice Date]), today())
2 Column for month in text format
MonthT = FORMAT( CalendarInv[Date], "MMM")
3 Column for month in number format
MonthN = Month (CalendarInv[Date])
Then go to field list on the right hand side Click on MonthT
then go to modelling / sort by column and select MonthN
The final step is as follows
NB Creating calendar table
http://community.powerbi.com/t5/Desktop/Possible-Tip-Trick-Dynamic-Date-Dimension-Table/td-p/8462



7 Replies
 RJResolver II
OK got it
https://support.powerbi.com/knowledgebase/articles/592116
Go to data (left hand side button) and click
Then go to the table to be sorted (right hand side)
You will need three columns in this calendar table for month
create
1 Main column (to set up the link column for Invoice Date)
CalendarInv = CALENDAR (MINX(Header, Header[Invoice Date]), today())
2 Column for month in text format
MonthT = FORMAT( CalendarInv[Date], "MMM")
3 Column for month in number format
MonthN = Month (CalendarInv[Date])
Then go to field list on the right hand side Click on MonthT
then go to modelling / sort by column and select MonthN
The final step is as follows
NB Creating calendar table
http://community.powerbi.com/t5/Desktop/Possible-Tip-Trick-Dynamic-Date-Dimension-Table/td-p/8462
 mariancruzNew Member
In my table there is no extra columns, just one column with months (Jan, Feb, March...). I do not want to add a new column since the purpose of using PowerBI is to minimize manual entries. How to get graphs with Jan-Feb-Mar-April as x-axis instead of April-Feb-March.... I do not want to have this "alphabetical order", please remove it. Most of the historical graphs need secuencial order, historical, not "alphabetic". It is an error from Power BI, please solve it in a new version or let me know how to change it, we did not find it ... Thanks in advance
- odhernandezNew Member
Hello,
We are gettign an error when trying to use the CalendarInv = CALENDAR (MINX(Header, Header[Invoice Date]), today()) statement. Can you please assist?
A table of multiple values was supplied where a single value was expected.
- RJResolver II
- plebloNew Member
I just created a small chart with 2 colums 1 all the names of the month then one the number of the month.
Jan 1
Feb 2
Mar 3
ECT....
Since all of my data was pulled in with the short text already it i just did a relationship between month and then did the sort based off the number.
 AnonymousNot applicable
Found an easier method.
1. Add a column 'Mth' = Jan, Feb, Mar... in the main data set which has the data to be analyzed. this column can be derived from the date column.
2. Create a new query (MTH_TAB) with 2 columns. Mth | Mth_No.
Mth = Jan, Feb, Mar, etc. Mth_No = 1, 2, 3, ..
3. Save and let Power BI create the Relationship between Mth column in the main dataset and the MTH_TAB.
That's it, you can sort by Mth_No in the visualization chart. Use Tab> Modelling and click on 'Sort By Coliumn' button while hightlighting the Mth_No column of MTH_TAB in the right sidebar.