- Power BI forums
- Updates
- News & Announcements
- Get Help with Power BI
- Desktop
- Service
- Report Server
- Power Query
- Mobile Apps
- Developer
- DAX Commands and Tips
- Custom Visuals Development Discussion
- Health and Life Sciences
- Power BI Spanish forums
- Translated Spanish Desktop
- Power Platform Integration - Better Together!
- Power Platform Integrations (Read-only)
- Power Platform and Dynamics 365 Integrations (Read-only)
- Training and Consulting
- Instructor Led Training
- Dashboard in a Day for Women, by Women
- Galleries
- Community Connections & How-To Videos
- COVID-19 Data Stories Gallery
- Themes Gallery
- Data Stories Gallery
- R Script Showcase
- Webinars and Video Gallery
- Quick Measures Gallery
- 2021 MSBizAppsSummit Gallery
- 2020 MSBizAppsSummit Gallery
- 2019 MSBizAppsSummit Gallery
- Events
- Ideas
- Custom Visuals Ideas
- Issues
- Issues
- Events
- Upcoming Events
- Community Blog
- Power BI Community Blog
- Custom Visuals Community Blog
- Community Support
- Community Accounts & Registration
- Using the Community
- Community Feedback
Register now to learn Fabric in free live sessions led by the best Microsoft experts. From Apr 16 to May 9, in English and Spanish.
- Power BI forums
- Forums
- Get Help with Power BI
- Desktop
- Re: Sort Area Group, Type and Rank_avgCost or Rank...
- Subscribe to RSS Feed
- Mark Topic as New
- Mark Topic as Read
- Float this Topic for Current User
- Bookmark
- Subscribe
- Printer Friendly Page
- Mark as New
- Bookmark
- Subscribe
- Mute
- Subscribe to RSS Feed
- Permalink
- Report Inappropriate Content
Sort Area Group, Type and Rank_avgCost or Rank_avgSales in a matrix visual
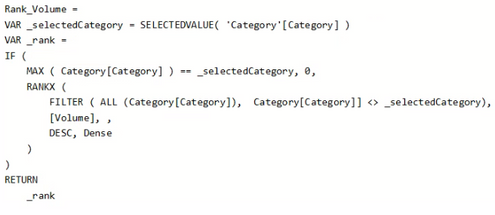
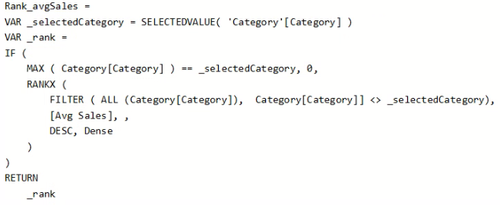
I have a Matrix visual consisting of Area Group, Type, Category and have Volume, Avg Cost and Avg Sales (measures) as the values The Volume = SUM(Volume), Avg Cost = Average(Cost) and Avg Sales = Average(Sales). I created TopN parameter for my Slicer. I created a rank based on Volume, Avg Cost and Avg Sales. These Ranks will rank Volume, Avg Cost, Avg Sales excluding Category that is selected in a Category slicer.
However, when I created a matrix visual, I sort by Area Group, Type, Category and Rank_Volume, It works fine. But when I create a matrix visual and sort by Area Group, Type, Category and Rank_avgCost, Only the Rank_avgCost is sorted but Area Group, Type are not sorted. The same thing happens with Rank_avgSales.
How Can I sorted Area Group, Type and Rank_avgCost or avgSales. Please help
- Mark as New
- Bookmark
- Subscribe
- Mute
- Subscribe to RSS Feed
- Permalink
- Report Inappropriate Content
Hi @Anonymous ,
It is very difficult to analyze without looking at the data and just by imagining.Any chance you can share a PBIX file with dummy data?
Best Regards,
Liang
If this post helps, then please consider Accept it as the solution to help the other members find it more quickly.
- Mark as New
- Bookmark
- Subscribe
- Mute
- Subscribe to RSS Feed
- Permalink
- Report Inappropriate Content
https://drive.google.com/file/d/10AY9-5vWOcmTz9ybt5g0EXmlU7Iem5z1/view?usp=sharing
the sample pbix to download. Help will be greatly appreciated
- Mark as New
- Bookmark
- Subscribe
- Mute
- Subscribe to RSS Feed
- Permalink
- Report Inappropriate Content
I checked your files and found that the problem was in the average function.
Unfortunately ,I did my best but couldn't change the group and type sorting.
- Mark as New
- Bookmark
- Subscribe
- Mute
- Subscribe to RSS Feed
- Permalink
- Report Inappropriate Content
Hi V-lianl-msft,
I wrongly click on accept solution instead of reply. I don't know how to revert it not accepting solution.
Anyway, I have a sample pbix for you to look at,
https://drive.google.com/file/d/10AY9-5vWOcmTz9ybt5g0EXmlU7Iem5z1/view?usp=sharing
If you have issue of download let me know.
Thanks
Helpful resources

Microsoft Fabric Learn Together
Covering the world! 9:00-10:30 AM Sydney, 4:00-5:30 PM CET (Paris/Berlin), 7:00-8:30 PM Mexico City

Power BI Monthly Update - April 2024
Check out the April 2024 Power BI update to learn about new features.

| User | Count |
|---|---|
| 111 | |
| 94 | |
| 83 | |
| 67 | |
| 59 |
| User | Count |
|---|---|
| 151 | |
| 121 | |
| 104 | |
| 87 | |
| 67 |


