- Power BI forums
- Updates
- News & Announcements
- Get Help with Power BI
- Desktop
- Service
- Report Server
- Power Query
- Mobile Apps
- Developer
- DAX Commands and Tips
- Custom Visuals Development Discussion
- Health and Life Sciences
- Power BI Spanish forums
- Translated Spanish Desktop
- Power Platform Integration - Better Together!
- Power Platform Integrations (Read-only)
- Power Platform and Dynamics 365 Integrations (Read-only)
- Training and Consulting
- Instructor Led Training
- Dashboard in a Day for Women, by Women
- Galleries
- Community Connections & How-To Videos
- COVID-19 Data Stories Gallery
- Themes Gallery
- Data Stories Gallery
- R Script Showcase
- Webinars and Video Gallery
- Quick Measures Gallery
- 2021 MSBizAppsSummit Gallery
- 2020 MSBizAppsSummit Gallery
- 2019 MSBizAppsSummit Gallery
- Events
- Ideas
- Custom Visuals Ideas
- Issues
- Issues
- Events
- Upcoming Events
- Community Blog
- Power BI Community Blog
- Custom Visuals Community Blog
- Community Support
- Community Accounts & Registration
- Using the Community
- Community Feedback
Register now to learn Fabric in free live sessions led by the best Microsoft experts. From Apr 16 to May 9, in English and Spanish.
- Power BI forums
- Forums
- Get Help with Power BI
- Desktop
- Re: Slicer from table 1 applies to table 2 (same p...
- Subscribe to RSS Feed
- Mark Topic as New
- Mark Topic as Read
- Float this Topic for Current User
- Bookmark
- Subscribe
- Printer Friendly Page
- Mark as New
- Bookmark
- Subscribe
- Mute
- Subscribe to RSS Feed
- Permalink
- Report Inappropriate Content
Slicer from table 1 applies to table 2 (same page) - Check and compare columns in different tables
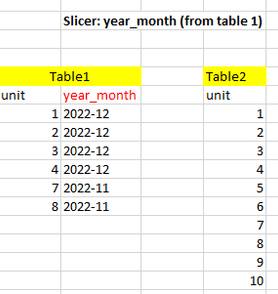
I have following two tables:
In current visual, I have the [year_month] from table 1 as a slicer. I want to create a new flag column in table 2 to check if [Unit] from Table 2 exists in Table 1.
Raw Data:
My problems is I can get the flag column created in Table 2, but the slicer from Table 1 does not apply to table 2, even they are in the same page/view. For example, if I select year_month slicer to "2022-12", my current output still has unit 7 and 8 flag as YES, they should be NO because slicer '2022-12' filter out records (unit 7, 8 ) from table 1.
my current code (add new column): flag= IF ( Table2[unit] IN DISTINCT ( Table1[unit]), "YES", "NO" )
I removed all relationship between table 1 and table 2, because I want to display all values 1-10 in table 2, can anyone let me know how to upload the PBIX file?
Solved! Go to Solution.
- Mark as New
- Bookmark
- Subscribe
- Mute
- Subscribe to RSS Feed
- Permalink
- Report Inappropriate Content
Hi, @ljr91-us
I create a measure (reference from amitchandak Reply)
And there is a relationship with Table1[unit] and Table2[unit]
Measure =
var cnt = countx(filter(Table1, SELECTEDVALUE(Table2[Unit]) = Table1[Unit]) ,Table1[Unit])

return

if(isblank(cnt), "no", "Yes")
Result :
Best regards,
Joseph
- Mark as New
- Bookmark
- Subscribe
- Mute
- Subscribe to RSS Feed
- Permalink
- Report Inappropriate Content
@ljr91-us , new column in table 2
new col = var_cnt = countx(filter(Table1, Table2[Unit] =Table1[Unit]) ,Table1[Unit])
return
if(isblank(_cnt), "no", "Yes")
refer 4 ways (related, relatedtable, lookupvalue, sumx/minx/maxx with filter) to copy data from one table to another
https://www.youtube.com/watch?v=Wu1mWxR23jU
https://www.youtube.com/watch?v=czNHt7UXIe8
Microsoft Power BI Learning Resources, 2023 !!
Learn Power BI - Full Course with Dec-2022, with Window, Index, Offset, 100+ Topics !!
Did I answer your question? Mark my post as a solution! Appreciate your Kudos !! Proud to be a Super User! !!
- Mark as New
- Bookmark
- Subscribe
- Mute
- Subscribe to RSS Feed
- Permalink
- Report Inappropriate Content
Hi,
It is the same as my current output, which is not the desired output.
I want to have
1) table 2 to display all 1-10 unit
2) having slicer filter out table 1 records, then use filtered records to compare with table 2
- Mark as New
- Bookmark
- Subscribe
- Mute
- Subscribe to RSS Feed
- Permalink
- Report Inappropriate Content
Hi, @ljr91-us
I create a measure (reference from amitchandak Reply)
And there is a relationship with Table1[unit] and Table2[unit]
Measure =
var cnt = countx(filter(Table1, SELECTEDVALUE(Table2[Unit]) = Table1[Unit]) ,Table1[Unit])

return

if(isblank(cnt), "no", "Yes")
Result :
Best regards,
Joseph
Helpful resources

Microsoft Fabric Learn Together
Covering the world! 9:00-10:30 AM Sydney, 4:00-5:30 PM CET (Paris/Berlin), 7:00-8:30 PM Mexico City

Power BI Monthly Update - April 2024
Check out the April 2024 Power BI update to learn about new features.

| User | Count |
|---|---|
| 107 | |
| 100 | |
| 80 | |
| 63 | |
| 58 |
| User | Count |
|---|---|
| 148 | |
| 111 | |
| 94 | |
| 84 | |
| 67 |


