Forum Discussion

 Advocate I
Show when records change?
Hello,
I am wondering if Power BI is able to show when records change for an individual.
In the table below, each person has a new record created when they have a change in their value, or score. I would like to know if its possible to create a matrix to show only when a Score has changed, and then figure out the difference in value changes, % difference of value change, previous score and new score - (see second picture for example of desired result).
An end date of 1/1/9999 would indicate this person is still in that score and value if that means anything.
I thought maybe using 'Earlier' formula to get the end date before 1/1/9999 would somewhat work but it ended up not making sense to me in the end.
Not sure if this is possible, but anything would be great. The main goal would be to identify when the score changed for a person and the dates, the other things such as value change, and value change (%) are more of a nice to have.
Really appreciate any help.
Hi mariner84 ,
Based on your shared table, we can create a calculated table using following formula to meet your requirement:
Desired Table =
VAR t =
    SUMMARIZECOLUMNS (
        'Data'[ID],
        'Data'[Name],
        'Data'[Score],
        "Start Date", MIN ( 'Data'[Start Date] ),
        "End Date", MAX ( 'Data'[End Date] ),
        "Value", MAX ( 'Data'[Value] ),
        "MaxValue", MAX ( 'Data'[Value] ),
        "MinValue", MIN ( 'Data'[Value] )
    )
VAR t2 =
    ADDCOLUMNS (
        FILTER (
            ADDCOLUMNS (
                t,
                "Temp", COUNTROWS ( FILTER ( t, 'Data'[Name] = EARLIER ( Data[Name] ) ) )
            ),
            [Temp] > 1
        ),
        "index", RANKX ( FILTER ( t, 'Data'[ID] = EARLIER ( Data[ID] ) ), [Start Date],, ASC )
    )
VAR t3 =
    ADDCOLUMNS (
        t2,
        "Value Change", MAXX (
            FILTER ( t2, [index] = EARLIER ( [index] ) + 1 && [ID] = EARLIER ( [ID] ) ),
            [MinValue]
        ) - [MaxValue]
    )
VAR t4 =
    ADDCOLUMNS (
        t3,
        "Value Change %", [Value Change] / [Value],
        "Change End Date", [End Date],
        "Change Start Date", MAXX (
            FILTER ( t3, [index] = EARLIER ( [index] ) + 1 && [ID] = EARLIER ( [ID] ) ),
            [Start Date]
        ),
        "Prior Score", [Score],
        "Current Score", MAXX (
            FILTER ( t3, [index] = EARLIER ( [index] ) + 1 && [ID] = EARLIER ( [ID] ) ),
            [Score]
        )
    )
VAR resultt =
    SELECTCOLUMNS (
        FILTER ( t4, [Temp] <> [index] ),
        "ID", [ID],
        "Name", [Name],
        "Value Change", [Value Change],
        "Value Change (%)", [Value Change %],
        "Prior Score Change", [Prior Score],
        "Current Score", [Current Score],
        "Change End Date", [Change End Date],
        "Change Start Date", [Change Start Date]
    )
RETURN
    resultt
BTW, pbix as attached.
Best regards,
Community Support Team _ Dong Li
If this post helps, then please consider Accept it as the solution to help the other members find it more quickly.
11 Replies
- kentyler
Solution Sage
Unfortunately "EARLIER" is sort of misnamed, it returns a value from an outer filter function. I found this post which seems to be what you could use
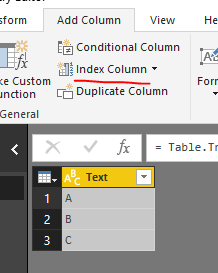
In DAX, there's no order internally for records in table. You have to add an index column in your table.
PreviousText = CALCULATE(MAX(Table1[Text]),FILTER(Table1,Table1[Index]=EARLIER(Table1[Index])-1))
- kentyler
The index is to order the table so you can look for min and max values. In your example you can't use the ID, because it repeats
You need a sequential index 1,2,3,4 applied to all the rows so that when you're on a given row you can use < to find the row above it. This assumes you have the rows sorted to make that the one you want.
 v-lid-msft
Community Support
Hi mariner84 ,
Based on your shared table, we can create a calculated table using following formula to meet your requirement:
Desired Table =
VAR t =
    SUMMARIZECOLUMNS (
        'Data'[ID],
        'Data'[Name],
        'Data'[Score],
        "Start Date", MIN ( 'Data'[Start Date] ),
        "End Date", MAX ( 'Data'[End Date] ),
        "Value", MAX ( 'Data'[Value] ),
        "MaxValue", MAX ( 'Data'[Value] ),
        "MinValue", MIN ( 'Data'[Value] )
    )
VAR t2 =
    ADDCOLUMNS (
        FILTER (
            ADDCOLUMNS (
                t,
                "Temp", COUNTROWS ( FILTER ( t, 'Data'[Name] = EARLIER ( Data[Name] ) ) )
            ),
            [Temp] > 1
        ),
        "index", RANKX ( FILTER ( t, 'Data'[ID] = EARLIER ( Data[ID] ) ), [Start Date],, ASC )
    )
VAR t3 =
    ADDCOLUMNS (
        t2,
        "Value Change", MAXX (
            FILTER ( t2, [index] = EARLIER ( [index] ) + 1 && [ID] = EARLIER ( [ID] ) ),
            [MinValue]
        ) - [MaxValue]
    )
VAR t4 =
    ADDCOLUMNS (
        t3,
        "Value Change %", [Value Change] / [Value],
        "Change End Date", [End Date],
        "Change Start Date", MAXX (
            FILTER ( t3, [index] = EARLIER ( [index] ) + 1 && [ID] = EARLIER ( [ID] ) ),
            [Start Date]
        ),
        "Prior Score", [Score],
        "Current Score", MAXX (
            FILTER ( t3, [index] = EARLIER ( [index] ) + 1 && [ID] = EARLIER ( [ID] ) ),
            [Score]
        )
    )
VAR resultt =
    SELECTCOLUMNS (
        FILTER ( t4, [Temp] <> [index] ),
        "ID", [ID],
        "Name", [Name],
        "Value Change", [Value Change],
        "Value Change (%)", [Value Change %],
        "Prior Score Change", [Prior Score],
        "Current Score", [Current Score],
        "Change End Date", [Change End Date],
        "Change Start Date", [Change Start Date]
    )
RETURN
    resultt
BTW, pbix as attached.
Best regards,
Community Support Team _ Dong Li
If this post helps, then please consider Accept it as the solution to help the other members find it more quickly. viferenc
Helper II
Hi,
I´m using your dax formula for my calculation, in case I do not get the correct view.
this is the base data from where I take data.
I use the followin formula:
Desired Table =VAR t =SUMMARIZECOLUMNS ('Gross Price'[Material],'Gross Price'[Customer],'Gross Price'[Gross price EUR],"Start Date", MIN ( 'Gross Price'[Valid From] ),"End Date", MAX ( 'Gross Price'[Valid to ]),"Value", MAX ( 'Gross Price'[Gross price EUR] ),"MaxValue", MAX ( 'Gross Price'[Gross price EUR] ),"MinValue", MIN ( 'Gross Price'[Gross price EUR]))VAR t2 =ADDCOLUMNS (FILTER (ADDCOLUMNS (t,"Temp", COUNTROWS ( FILTER ( t, 'Gross Price'[Customer] = EARLIER('Gross Price'[Customer])))),[Temp] > 1),"index", RANKX ( FILTER ( t, 'Gross Price'[Material] = EARLIER ('Gross Price'[Material] ) && 'Gross Price'[Customer]=EARLIER('Gross Price'[Customer])), [Start Date],, ASC ))VAR t3 =ADDCOLUMNS (t2,"Value Change", MAXX (FILTER ( t2, [index] = EARLIER ( [index] ) + 1 && [Material] = EARLIER ( [Material] )&& [Customer]=EARLIER([Customer]) ),[MinValue]) - [MaxValue])VAR t4 =ADDCOLUMNS (t3,"Value Change %", [Value Change] / [Value],"Change End Date", [End Date],"Change Start Date", MAXX (FILTER ( t3, [index] = EARLIER ( [index] ) + 1 && [Material] = EARLIER ( [Material] ) && [Customer]=EARLIER([Customer]) ),[Start Date]),"Prior Score", [Gross price EUR],"Current Score", MAXX (FILTER ( t3, [index] = EARLIER ( [index] ) + 1 && [Material] = EARLIER ( [Material] ) && [Customer]=EARLIER([Customer])),[Gross price EUR]))VAR resultt =SELECTCOLUMNS (FILTER ( t4, [Temp] <> [index] ),"ID", [Material],"Name", [Customer],"Value Change", [Value Change],"Value Change (%)", [Value Change %],"Prior Score Change", [Prior Score],"Current Score", [Current Score],"Change End Date", [Change End Date],"Change Start Date", [Change Start Date])RETURNresulttMy result:The problem is, that I should see 3 line because from 01.08.2021 the current price is 8,67€ (there was decrease) and not 8,74€
Thank you for your help
BR
Feri
 adelmonte
Resolver I
Hi,
How could I adapt this script for my needs?I have a table with Orders, Products, Delivery Date, Email update date, Email update time, Depo1, Depo2
I receive up to 4 updates of initial order for one OrderID, and Delivery Date where quantity can change. I need a column with the latest updated quantity, one column with old quantity per Depo1 and Depo2 the same.Regards,
Alex
RAW TableDesired outcome