- Power BI forums
- Updates
- News & Announcements
- Get Help with Power BI
- Desktop
- Service
- Report Server
- Power Query
- Mobile Apps
- Developer
- DAX Commands and Tips
- Custom Visuals Development Discussion
- Health and Life Sciences
- Power BI Spanish forums
- Translated Spanish Desktop
- Power Platform Integration - Better Together!
- Power Platform Integrations (Read-only)
- Power Platform and Dynamics 365 Integrations (Read-only)
- Training and Consulting
- Instructor Led Training
- Dashboard in a Day for Women, by Women
- Galleries
- Community Connections & How-To Videos
- COVID-19 Data Stories Gallery
- Themes Gallery
- Data Stories Gallery
- R Script Showcase
- Webinars and Video Gallery
- Quick Measures Gallery
- 2021 MSBizAppsSummit Gallery
- 2020 MSBizAppsSummit Gallery
- 2019 MSBizAppsSummit Gallery
- Events
- Ideas
- Custom Visuals Ideas
- Issues
- Issues
- Events
- Upcoming Events
- Community Blog
- Power BI Community Blog
- Custom Visuals Community Blog
- Community Support
- Community Accounts & Registration
- Using the Community
- Community Feedback
Earn a 50% discount on the DP-600 certification exam by completing the Fabric 30 Days to Learn It challenge.
- Power BI forums
- Forums
- Get Help with Power BI
- Desktop
- Show drivers actively on a job by 15 minute increm...
- Subscribe to RSS Feed
- Mark Topic as New
- Mark Topic as Read
- Float this Topic for Current User
- Bookmark
- Subscribe
- Printer Friendly Page
- Mark as New
- Bookmark
- Subscribe
- Mute
- Subscribe to RSS Feed
- Permalink
- Report Inappropriate Content
Show drivers actively on a job by 15 minute increments on a chart
Hello,
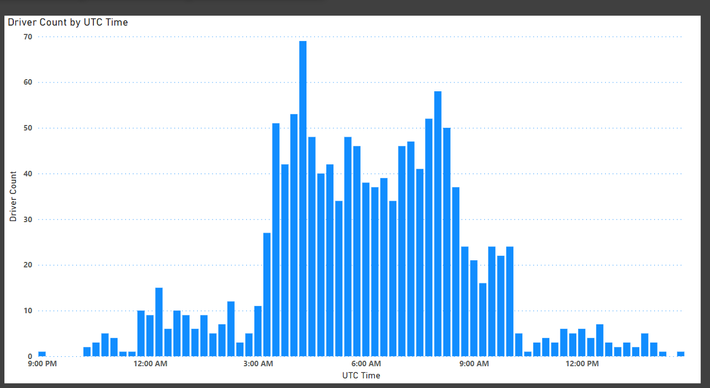
I have timestamps of when drivers accepted a job and completed a job. However I am needing to create a chart with 15 minute increments showing the total number of drivers that were actively on a job. Basically any time between the start and finish of a job I would want to see that driver counted on my chart. Any tips for doing this?
From the Accepted Time to Completed time I would expect this driver to be counted as a working driver on the chart for 5:30, 5:45, 6:00. But I dont not know how to achieve this with just timestamps.
Example chart:
Thank you!
Solved! Go to Solution.
- Mark as New
- Bookmark
- Subscribe
- Mute
- Subscribe to RSS Feed
- Permalink
- Report Inappropriate Content
Hi @AndrewWstry
You can create a table
Sample data
Then you can create a table
Table 3 = GENERATESERIES(MAX('Table'[Column2]) , MAX('Table'[Column1]) , 1/24/2/2)
Output
And you can refer to the following link.
Creating a List of Numbers or Dates in Power BI using GenerateSeries Function in DAX - RADACAD
Best Regards!
Yolo Zhu
If this post helps, then please consider Accept it as the solution to help the other members find it more quickly.
- Mark as New
- Bookmark
- Subscribe
- Mute
- Subscribe to RSS Feed
- Permalink
- Report Inappropriate Content
Please provide your work-in-progress Power BI Desktop file (with sensitive information removed) that covers your issue or question completely in a usable format (not as a screenshot).
https://community.fabric.microsoft.com/t5/Community-Blog/How-to-provide-sample-data-in-the-Power-BI-...
Please show the expected outcome based on the sample data you provided.
https://community.fabric.microsoft.com/t5/Desktop/How-to-Get-Your-Question-Answered-Quickly/m-p/1447...
This allows members of the Forum to assess the state of the model, report layer, relationships, and any DAX applied.
- Mark as New
- Bookmark
- Subscribe
- Mute
- Subscribe to RSS Feed
- Permalink
- Report Inappropriate Content
Hi @AndrewWstry
You can create a table
Sample data
Then you can create a table
Table 3 = GENERATESERIES(MAX('Table'[Column2]) , MAX('Table'[Column1]) , 1/24/2/2)
Output
And you can refer to the following link.
Creating a List of Numbers or Dates in Power BI using GenerateSeries Function in DAX - RADACAD
Best Regards!
Yolo Zhu
If this post helps, then please consider Accept it as the solution to help the other members find it more quickly.
Helpful resources
| User | Count |
|---|---|
| 98 | |
| 90 | |
| 83 | |
| 70 | |
| 67 |
| User | Count |
|---|---|
| 113 | |
| 104 | |
| 101 | |
| 73 | |
| 65 |


