Huge last-minute discounts for FabCon Vienna from September 15-18, 2025
Supplies are limited. Contact info@espc.tech right away to save your spot before the conference sells out.
Get your discount- Power BI forums
- Get Help with Power BI
- Desktop
- Service
- Report Server
- Power Query
- Mobile Apps
- Developer
- DAX Commands and Tips
- Custom Visuals Development Discussion
- Health and Life Sciences
- Power BI Spanish forums
- Translated Spanish Desktop
- Training and Consulting
- Instructor Led Training
- Dashboard in a Day for Women, by Women
- Galleries
- Data Stories Gallery
- Themes Gallery
- Contests Gallery
- Quick Measures Gallery
- Notebook Gallery
- Translytical Task Flow Gallery
- TMDL Gallery
- R Script Showcase
- Webinars and Video Gallery
- Ideas
- Custom Visuals Ideas (read-only)
- Issues
- Issues
- Events
- Upcoming Events
Score big with last-minute savings on the final tickets to FabCon Vienna. Secure your discount
- Power BI forums
- Forums
- Get Help with Power BI
- Desktop
- Show data label only to one line
- Subscribe to RSS Feed
- Mark Topic as New
- Mark Topic as Read
- Float this Topic for Current User
- Bookmark
- Subscribe
- Printer Friendly Page

- Mark as New
- Bookmark
- Subscribe
- Mute
- Subscribe to RSS Feed
- Permalink
- Report Inappropriate Content
Show data label only to one line
Hello
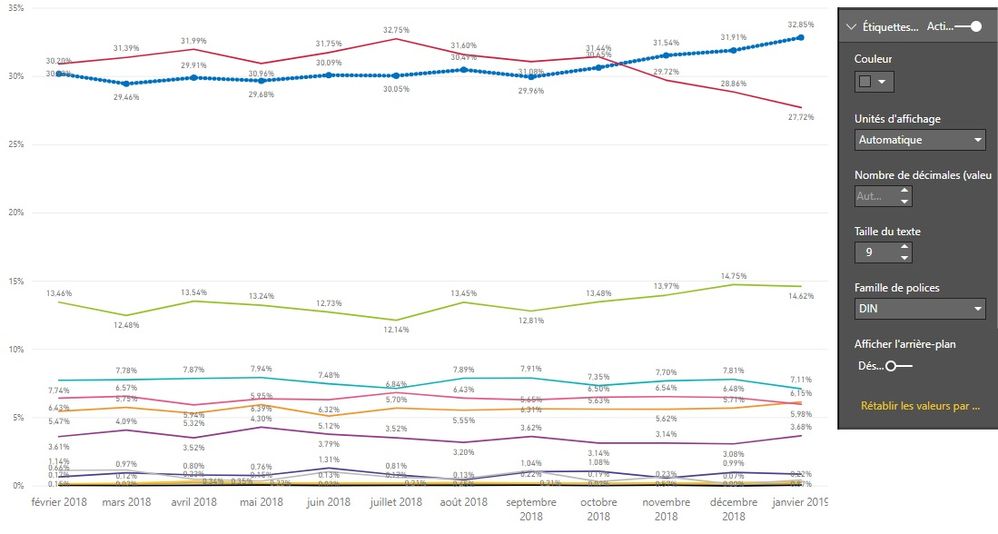
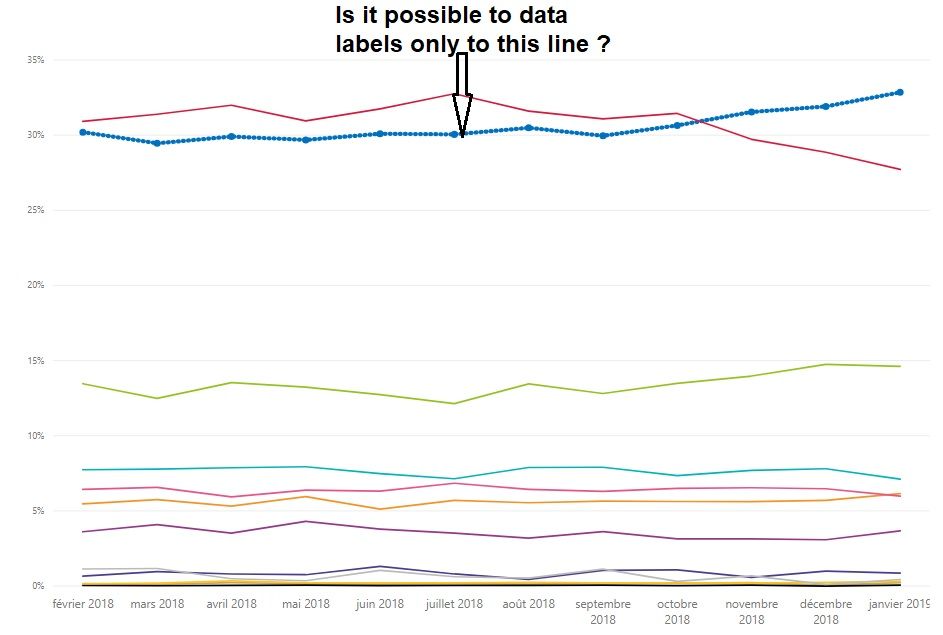
As attached below, I want to know if is it possible to show data labels only for one line in a line chart ?
What I can do is just changing the form or adding markers but data labels when activated are showed for all lines.
Solved! Go to Solution.
- Mark as New
- Bookmark
- Subscribe
- Mute
- Subscribe to RSS Feed
- Permalink
- Report Inappropriate Content
@Anonymous - You can accomplish this by doing the following:
1. Creating a separate measure for each item in your legend, like calculate(<measure>, <legendtable>[legendcolumn] = "legend value")
2. Remove the legend and the current measure from the line chart.
3. Add all of the measures to the line chart.
4. Then Data Labels will have the Customize Series option.


- Mark as New
- Bookmark
- Subscribe
- Mute
- Subscribe to RSS Feed
- Permalink
- Report Inappropriate Content
Hi @Anonymous ,
Could you please tell me if your problem has been solved? If it is, could you please mark the helpful replies as Answered to close this topic?
Regards,
Daniel He
If this post helps, then please consider Accept it as the solution to help the other members find it more quickly.
- Mark as New
- Bookmark
- Subscribe
- Mute
- Subscribe to RSS Feed
- Permalink
- Report Inappropriate Content
Hi @Anonymous ,
Based on my researc, I am afraid you could not achieve this feature currently, you do could refer to natelpeterson's solution, also you could submit an idea in ideas forum:
https://ideas.powerbi.com/forums/265200-power-bi-ideas
Regards,
Daniel He
If this post helps, then please consider Accept it as the solution to help the other members find it more quickly.
- Mark as New
- Bookmark
- Subscribe
- Mute
- Subscribe to RSS Feed
- Permalink
- Report Inappropriate Content
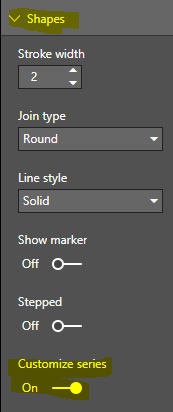
@Anonymous - Yes, you can, by doing using Customize Series. It will allow you to format each line individually:

- Mark as New
- Bookmark
- Subscribe
- Mute
- Subscribe to RSS Feed
- Permalink
- Report Inappropriate Content
@Anonymous wrote:@Anonymous - Yes, you can, by doing using Customize Series. It will allow you to format each line individually:
This solution worked for me. Thanks.
- Mark as New
- Bookmark
- Subscribe
- Mute
- Subscribe to RSS Feed
- Permalink
- Report Inappropriate Content
This is a bit of a hack but you can make a copy of the graph so you have two identical graphs (make sure both the x and y axis are fixed to the same min/max). On one graph remove all of the lines you don't want to display the data and turn data labels on for this graph. On the second graph remove all of the lines you do want with data. If you then overlay them then you'll have the desigered effect.
- Mark as New
- Bookmark
- Subscribe
- Mute
- Subscribe to RSS Feed
- Permalink
- Report Inappropriate Content
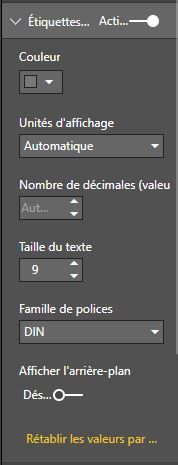
@Anonymous I want to show data labels not change shapes, I didn't find customize series below labels
- Mark as New
- Bookmark
- Subscribe
- Mute
- Subscribe to RSS Feed
- Permalink
- Report Inappropriate Content
@Anonymous - You can accomplish this by doing the following:
1. Creating a separate measure for each item in your legend, like calculate(<measure>, <legendtable>[legendcolumn] = "legend value")
2. Remove the legend and the current measure from the line chart.
3. Add all of the measures to the line chart.
4. Then Data Labels will have the Customize Series option.
Helpful resources

Power BI Monthly Update - August 2025
Check out the August 2025 Power BI update to learn about new features.

Fabric Community Update - August 2025
Find out what's new and trending in the Fabric community.

| User | Count |
|---|---|
| 66 | |
| 60 | |
| 47 | |
| 33 | |
| 32 |


| User | Count |
|---|---|
| 86 | |
| 75 | |
| 56 | |
| 50 | |
| 45 |


