Fabric Data Days starts November 4th!
Advance your Data & AI career with 50 days of live learning, dataviz contests, hands-on challenges, study groups & certifications and more!
Get registered- Power BI forums
- Get Help with Power BI
- Desktop
- Service
- Report Server
- Power Query
- Mobile Apps
- Developer
- DAX Commands and Tips
- Custom Visuals Development Discussion
- Health and Life Sciences
- Power BI Spanish forums
- Translated Spanish Desktop
- Training and Consulting
- Instructor Led Training
- Dashboard in a Day for Women, by Women
- Galleries
- Data Stories Gallery
- Themes Gallery
- Contests Gallery
- Quick Measures Gallery
- Visual Calculations Gallery
- Notebook Gallery
- Translytical Task Flow Gallery
- TMDL Gallery
- R Script Showcase
- Webinars and Video Gallery
- Ideas
- Custom Visuals Ideas (read-only)
- Issues
- Issues
- Events
- Upcoming Events
Get Fabric Certified for FREE during Fabric Data Days. Don't miss your chance! Learn more
- Power BI forums
- Forums
- Get Help with Power BI
- Desktop
- Re: Show X axis with week number and month (But no...
- Subscribe to RSS Feed
- Mark Topic as New
- Mark Topic as Read
- Float this Topic for Current User
- Bookmark
- Subscribe
- Printer Friendly Page
- Mark as New
- Bookmark
- Subscribe
- Mute
- Subscribe to RSS Feed
- Permalink
- Report Inappropriate Content
Show X axis with week number and month (But no Concatenate labels in formatting)
Hi folks,
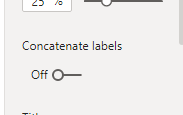
I would like to have week number and month show together in x axis. But I didnt find the off toggle of Concatenate labels in the formatting. No idea is I miss out something in the line graph. Kindly advice.
Expected outcome:
Please have a look on my pbix: https://ufile.io/66mkuot2
Appreciate any help you can provide to me.
Solved! Go to Solution.
- Mark as New
- Bookmark
- Subscribe
- Mute
- Subscribe to RSS Feed
- Permalink
- Report Inappropriate Content
Hi @NickProp28,
After switching off concatenate labels as:
Drill down:
Here is the output:
If you want to learn more, please refer: https://community.powerbi.com/t5/Community-Blog/How-to-change-the-granularity-of-date-in-X-axis-of-l...
Best Regards
Link
If this post helps then please consider Accept it as the solution to help the other members find it more quickly.
- Mark as New
- Bookmark
- Subscribe
- Mute
- Subscribe to RSS Feed
- Permalink
- Report Inappropriate Content
@NickProp28 , You need to week and Month(Month should have sort order) , Put both on them on the X-axis and sort on them (using three dots), Switch off concatenate labels
- Mark as New
- Bookmark
- Subscribe
- Mute
- Subscribe to RSS Feed
- Permalink
- Report Inappropriate Content
Dear @amitchandak ,
Thanks for the response.
I have put month and week on the axis, but the (three dot) doesnt have the sort.
Please have a look on my pbix: https://ufile.io/66mkuot2
Helpful resources

Fabric Data Days
Advance your Data & AI career with 50 days of live learning, contests, hands-on challenges, study groups & certifications and more!

Power BI Monthly Update - October 2025
Check out the October 2025 Power BI update to learn about new features.


