This time we’re going bigger than ever. Fabric, Power BI, SQL, AI and more. We're covering it all. You won't want to miss it.
Learn moreLevel up your Power BI skills this month - build one visual each week and tell better stories with data! Get started
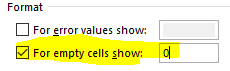
I am wondering if there is something similar to excel/pivot table"For empty cells show" (see picture below) in Power BI table/matrix visuals?
I know that is it possible to solve using DAX (replacing empty with 0 in the measure calculation) but I have a lot of measures that would need to be changed in that case
Solved! Go to Solution.
@Anonymous No, you would have to solve that in DAX. There is a "Show values with no data" but that just shows blanks if that is what the measure returns.
Hi @Anonymous ,
Adjust the corresponding measures, which have null values that you want to transform to 0:
newmeasure= var beforemeasure=(here is the measure you used before)
return if(beforemeasure=blank(),0,beforemeasure)
Wish it is helpful for you!
Best Regards
Lucien
Hi @Anonymous ,
Adjust the corresponding measures, which have null values that you want to transform to 0:
newmeasure= var beforemeasure=(here is the measure you used before)
return if(beforemeasure=blank(),0,beforemeasure)
Wish it is helpful for you!
Best Regards
Lucien
@Anonymous No, you would have to solve that in DAX. There is a "Show values with no data" but that just shows blanks if that is what the measure returns.
Could use mwhite space
Then create a measure with the function
Check out the April 2026 Power BI update to learn about new features.
Sign up to receive a private message when registration opens and key events begin.
If you have recently started exploring Fabric, we'd love to hear how it's going. Your feedback can help with product improvements.
| User | Count |
|---|---|
| 37 | |
| 29 | |
| 28 | |
| 21 | |
| 18 |
| User | Count |
|---|---|
| 66 | |
| 36 | |
| 29 | |
| 25 | |
| 24 |