Forum Discussion

Scaling Gantt and Line Chart after slicing
We would like to demonstrate equipment breakdowns against process tank volumes by displaying our volume in a line chart with a Gantt aligned above; the Gantt displays our breakdowns.
Consider the attached image; theTransfer Pump (failure) event should align with the indicated spot of the line graph. The end should very nearly coincide with the point at which the line graph descends again (they're a day apart).
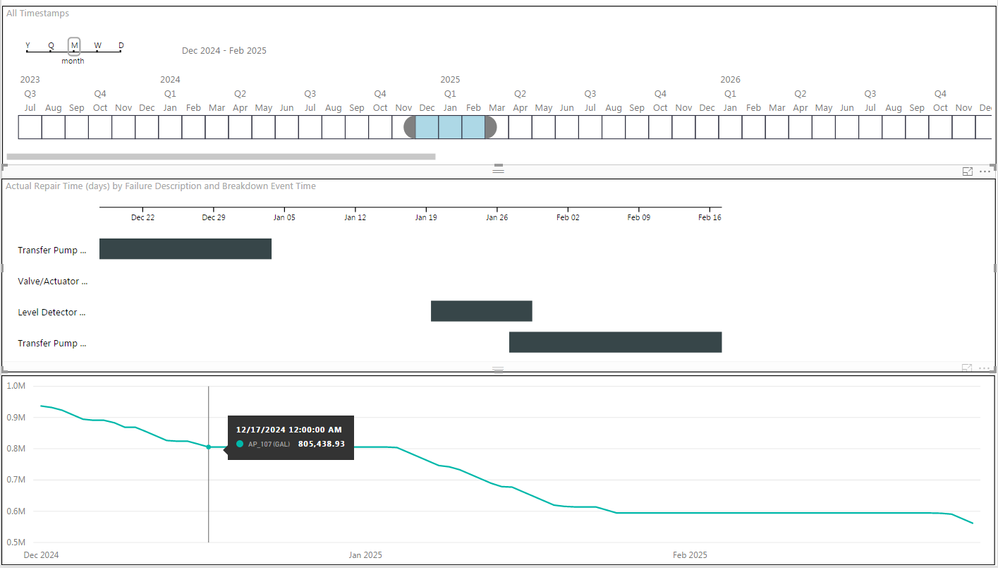
The line chart always scales nicely to the width of the visual, is there a way to scale the Gantt to the width of the visual? Setting the "Gantt Date type" under Format options doesn't accomplish the desired result; it just extends the Gantt to as long as it needs to be, either short of the visual width or longer.
You are correct; to scale the Gantt chart I have to edit the visual. It's scaled based on ticks; each tick is based on the number of milliseconds in the display unit (day, week, month, etc.). The axis is then set to the margin + number of ticks (among other things).
So to scale my Gantt chart to my line chart (which does make sense in my use, because the failure correlates directly to the volume represented in the line chart) I have to make the ticks dynamic based on the visual display rather than time frame.
If anyone's interested, I'll post the modified Gantt when I'm done.
6 Replies
 AnonymousNot applicable
I don’t think you can scale the Gantt to the width of the visual, the width of failure description in the Gannt is determined by the Duration.
Gantt chart and Line chart are two different charts, they use different scale type(Line chart uses Linear scale type ) and display report from different dimensions. In my opinion, it doesn’t make sense to scale the width of failure description in Gantt to match the width of points in Line Chart.
Regards,
Lydia Zhang Ballard-AtkinsFrequent Visitor
You are correct; to scale the Gantt chart I have to edit the visual. It's scaled based on ticks; each tick is based on the number of milliseconds in the display unit (day, week, month, etc.). The axis is then set to the margin + number of ticks (among other things).
So to scale my Gantt chart to my line chart (which does make sense in my use, because the failure correlates directly to the volume represented in the line chart) I have to make the ticks dynamic based on the visual display rather than time frame.
If anyone's interested, I'll post the modified Gantt when I'm done.
- AnonymousNot applicable
Ballard-Atkins,
You can post the modified Gantt and accept appropriate replies as answer, that way, other community members would easily find the solution when they get same issues.
Regards,
Lydia