Forum Discussion
Anonymous
4 years agoNot applicable
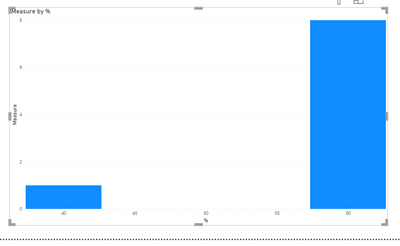
Same count for different percent values.
I have scutation where I created column chart with % on x axis and distinct values on y axis based on the % and count column in data So I have created measure to calculate values Measure = SUMX( ...
- Anonymous4 years ago
Hi Anonymous ,
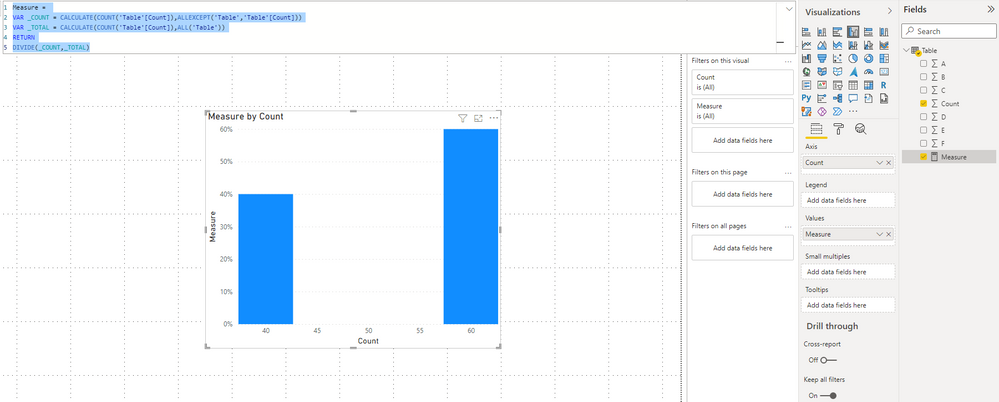
If you want to show 40% in 40 and show 60% in 60, please try this code.
Measure = VAR _COUNT = CALCULATE(COUNT('Table'[Count]),ALLEXCEPT('Table','Table'[Count])) VAR _TOTAL = CALCULATE(COUNT('Table'[Count]),ALL('Table')) RETURN DIVIDE(_COUNT,_TOTAL)Result is as below.
If this reply still couldn't help you solve your problem, please tell us more details about your table. Will you use columns A,B,C,D...in your calculation? Please share a same file and show us a screenshot with the result you want.
Best Regards,
Rico ZhouIf this post helps, then please consider Accept it as the solution to help the other members find it more quickly.
lbendlin
Super User
4 years agoPlease provide a more detailed explanation of what you are aiming to achieve. It is not clear (to me) from your description. Your sample data doesn't seem to match the chart.