- Power BI forums
- Updates
- News & Announcements
- Get Help with Power BI
- Desktop
- Service
- Report Server
- Power Query
- Mobile Apps
- Developer
- DAX Commands and Tips
- Custom Visuals Development Discussion
- Health and Life Sciences
- Power BI Spanish forums
- Translated Spanish Desktop
- Power Platform Integration - Better Together!
- Power Platform Integrations (Read-only)
- Power Platform and Dynamics 365 Integrations (Read-only)
- Training and Consulting
- Instructor Led Training
- Dashboard in a Day for Women, by Women
- Galleries
- Community Connections & How-To Videos
- COVID-19 Data Stories Gallery
- Themes Gallery
- Data Stories Gallery
- R Script Showcase
- Webinars and Video Gallery
- Quick Measures Gallery
- 2021 MSBizAppsSummit Gallery
- 2020 MSBizAppsSummit Gallery
- 2019 MSBizAppsSummit Gallery
- Events
- Ideas
- Custom Visuals Ideas
- Issues
- Issues
- Events
- Upcoming Events
- Community Blog
- Power BI Community Blog
- Custom Visuals Community Blog
- Community Support
- Community Accounts & Registration
- Using the Community
- Community Feedback
Register now to learn Fabric in free live sessions led by the best Microsoft experts. From Apr 16 to May 9, in English and Spanish.
- Power BI forums
- Forums
- Get Help with Power BI
- Desktop
- RANKX with SUMMARIZECOLUMNS and Filter
- Subscribe to RSS Feed
- Mark Topic as New
- Mark Topic as Read
- Float this Topic for Current User
- Bookmark
- Subscribe
- Printer Friendly Page
- Mark as New
- Bookmark
- Subscribe
- Mute
- Subscribe to RSS Feed
- Permalink
- Report Inappropriate Content
RANKX with SUMMARIZECOLUMNS and Filter
Hi all,
Here is a sample of my dataset, where:
- Job: one job can have multiple tasks, and be executed more than once in a day (job timestamp repeated).
- Task: multiple tasks happen within a job.
- Job TimeStamp: date and time the job started. One job can have multiple executions within a day.
- Job Date: date the job started.
- Job Status: can be either G or C.
- Unique Key: concatenation between Job and Job TimeStamp.
Here is a table I constructed using the following measures:
G = CALCULATE(DISTINCTCOUNTNOBLANK(Table1[Unique Key]),Table1[Job Status]="G")
Distinct Count Unique Key = DISTINCTCOUNTNOBLANK(Table1[Unique Key])

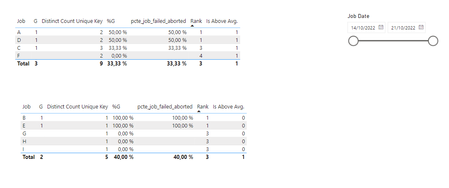
On the other hand, for those below average (Distinct Count Unique Key < Average):

This ranking should be filtered with a slicer by Job Date.
Ranking =
VAR SummaryTable =
FILTER(
SUMMARIZECOLUMNS(Table1[Job],Table1[Job Date],
"job_executions",DISTINCTCOUNTNOBLANK(Table1[Unique Key]),
"job_failed_aborted",CALCULATE(DISTINCTCOUNTNOBLANK(Table1[Unique Key]),Table1[Job Status]="G"),
"pcte_job_failed_aborted",CALCULATE(DISTINCTCOUNTNOBLANK(Table1[Unique Key]),Table1[Job Status]="G")/DISTINCTCOUNTNOBLANK(Table1[Unique Key])),
[job_failed_aborted]>0)
RETURN
RANKX(ALL(SummaryTable[job_name]),[pcte_job_failed_aborted],,DESC)
Could you please help me out?
Thanks a lot!
- Mark as New
- Bookmark
- Subscribe
- Mute
- Subscribe to RSS Feed
- Permalink
- Report Inappropriate Content
Hi @amitchandak ,
Thank you so much for your response; I tried to do as you mentioned, but got the following error:
Ranking =
VAR SummaryTable =
FILTER(
SUMMARIZE(Table1,Table1[Job],Table1[Job Date],
"job_executions",DISTINCTCOUNTNOBLANK(Table1[Unique Key]),
"job_failed_aborted",CALCULATE(DISTINCTCOUNTNOBLANK(Table1[Unique Key]),Table1[Job Status]="G"),
"pcte_job_failed_aborted",CALCULATE(DISTINCTCOUNTNOBLANK(Table1[Unique Key]),Table1[Job Status]="G")/DISTINCTCOUNTNOBLANK(Table1[Unique Key])),
[job_failed_aborted]>0)
RETURN
RANKX(SummaryTable,[pcte_job_failed_aborted],,DESC)
Error message: the value for 'pcte_job_failed_aborted' cannot be determined. Either the column doesn't exist, or there is no current row for this column.
- Mark as New
- Bookmark
- Subscribe
- Mute
- Subscribe to RSS Feed
- Permalink
- Report Inappropriate Content
@scaballerom , Create two measure like this and try
pcte_job_failed_aborted =Divide(CALCULATE(DISTINCTCOUNTNOBLANK(Table1[Unique Key]),Table1[Job Status]="G"),DISTINCTCOUNTNOBLANK(Table1[Unique Key]) )
Rank =
Rankx(
FILTER(
SUMMARIZE(allselected(Table1),Table1[Job],Table1[Job Date],
"job_executions",DISTINCTCOUNTNOBLANK(Table1[Unique Key]),
"job_failed_aborted",CALCULATE(DISTINCTCOUNTNOBLANK(Table1[Unique Key]),Table1[Job Status]="G")),
[job_failed_aborted]>0) , [pcte_job_failed_aborted] )
Microsoft Power BI Learning Resources, 2023 !!
Learn Power BI - Full Course with Dec-2022, with Window, Index, Offset, 100+ Topics !!
Did I answer your question? Mark my post as a solution! Appreciate your Kudos !! Proud to be a Super User! !!
- Mark as New
- Bookmark
- Subscribe
- Mute
- Subscribe to RSS Feed
- Permalink
- Report Inappropriate Content
Hi @Amit,
That seems to work great (see image below).
However, how would you incorporate the condition about the comparison on the average?
When I incorporate more sample data (see image below):
And use condition:

Could you please help with this issue? If needed, I can provide both the Excel sample data amb PBI sample report.
Thanks so much.
Best,
S
- Mark as New
- Bookmark
- Subscribe
- Mute
- Subscribe to RSS Feed
- Permalink
- Report Inappropriate Content
@scaballerom , Use summarize and when you give a table name use all or allselected
example
summarize(allselected(Table1), <Other columns>)
Microsoft Power BI Learning Resources, 2023 !!
Learn Power BI - Full Course with Dec-2022, with Window, Index, Offset, 100+ Topics !!
Did I answer your question? Mark my post as a solution! Appreciate your Kudos !! Proud to be a Super User! !!
Helpful resources

Microsoft Fabric Learn Together
Covering the world! 9:00-10:30 AM Sydney, 4:00-5:30 PM CET (Paris/Berlin), 7:00-8:30 PM Mexico City

Power BI Monthly Update - April 2024
Check out the April 2024 Power BI update to learn about new features.

| User | Count |
|---|---|
| 110 | |
| 94 | |
| 81 | |
| 66 | |
| 58 |
| User | Count |
|---|---|
| 150 | |
| 119 | |
| 104 | |
| 87 | |
| 67 |


