Forum Discussion

 Advocate II
Problems with accumulating in stacked column chart


 Microsoft Employee
In this scenario, your "running" measure is based on current date to specify the "up to date" range. So when going to 2018, there's no fact data, then your running total supposes to keep same value all the way to the end.
If you want to keep it in one year, you need to apply filter on month number like:
=
CALCULATE (
    [measure],
    FILTER ( ALLSELECTED ( Table ), DimDate[MonthNum] <= MAX ( DimDate[MonthNum] ) )
)
If you want to calculate the running total within each year, you should use TOTALYTD() function.
Regards,
 Advocate II
My problem is not limiting the dates to show me a year or a time line :smileyhappy:
My problem is, that when I look at my data pr year or pr month, the value is the same. Please look at the pictures.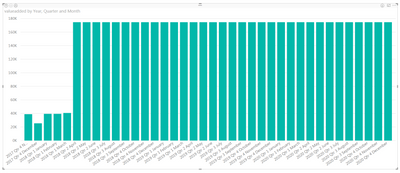

As you can see, the value is the same on the y-axis no matter how far I drill down.
Each one of my values has a start date (Date of first delivery). If I have a start date on the 1/1-2018, I want the value to show from that day until I tell it to stop. So lets say I have $100 pr day for this specific product. When I am on the day level, I want it to show me the $100 for each day. But if I drill up to the month level, I want the y-axis to display 3100 (31*100=3100). When if i drill up again, so I am on the Quarter level, I want the value to be 9000 (90*100=9000).
But right now, the value on the y-axis doesn't change when I drill through the different levels.
So how do I do that? :smileyvery-happy: