Forum Discussion

Power BI Group Total
I have mock dataset looks like below.
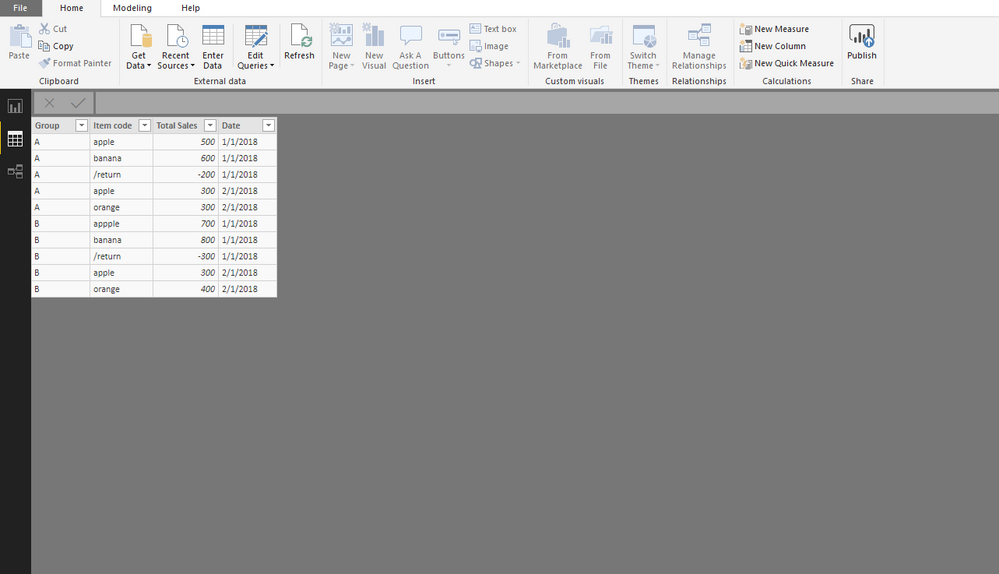
On my visualization, I have two problems:
1) I am trying to show the total sales by group. - called "group total". But on my dataset, I have Item Code called "/return". I do not want to list "/return" on my visualization. So I filtered it out through filters.
I created measure called "group total" with the following dax formula :
group total = CALCULATE(SUM(Table1[Total Sales]),ALLEXCEPT(Table1,Table1[Group],Table1[Date]))
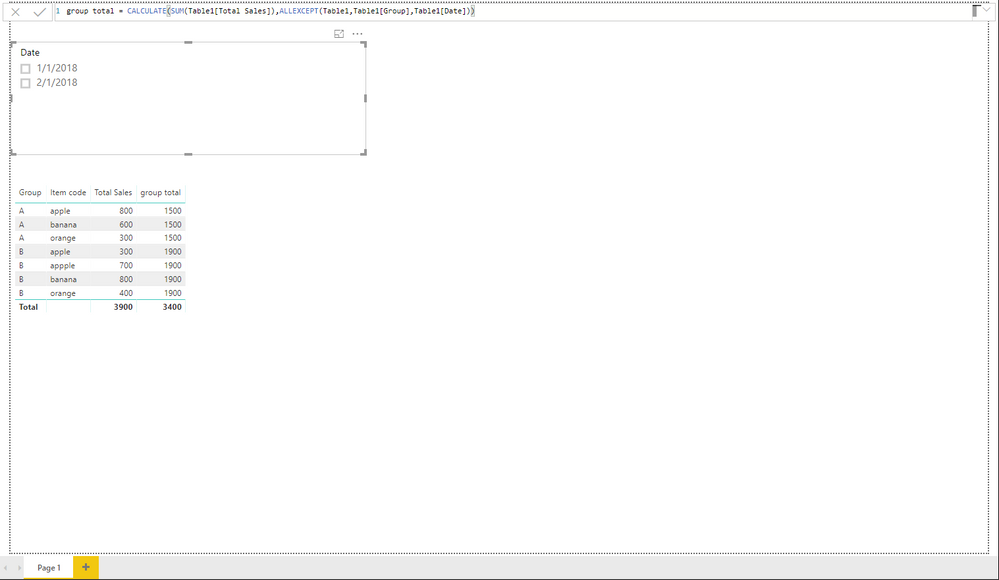
2. I want to add a column called "return" that sums all the "/return". So same group will show same amount of "return", just like "group total".
I created measure "return" just to show you what I want.
return = Calculate(Sum(Table1[Total Sales]),Filter(Table1,Find("/",Table1[Item code], ,0)<>0))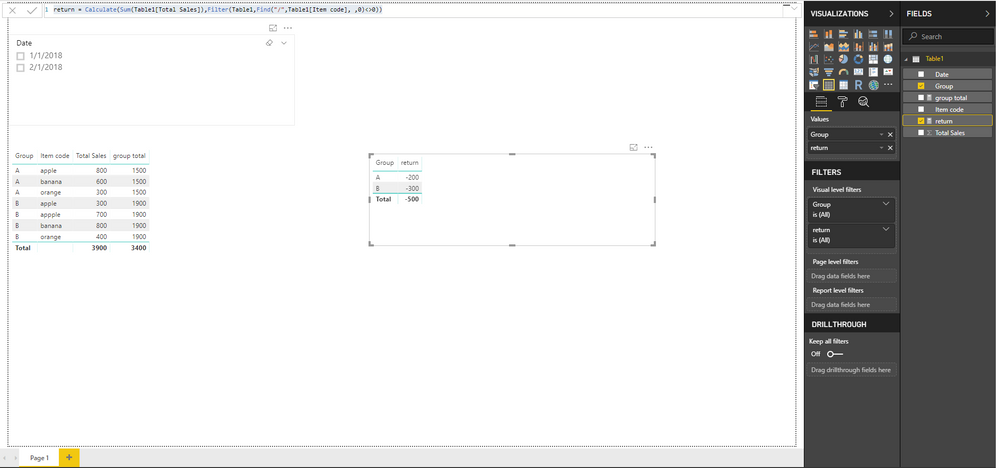
What I want eventually is something like this.

I hope I described my problem clear enough.
I would appreciate any help!
Anonymous - How about these:
return =
VAR __group = MAX('Table17'[Group])
RETURN
CALCULATE(SUM(Table17[Total Sales]),Filter(ALLEXCEPT(Table17,Table17[Date]),[Item code]="/return" && [Group]=__group))
group total = CALCULATE(SUMX(FILTER(Table17,[Item code]<>"/return"),[Total Sales]),ALLEXCEPT(Table17,Table17[Group],Table17[Date]))
Very minor tweaks.
Attached again, Page 5, Table 17.

12 Replies
- AnonymousNot applicable
Greg_Deckler I am not sure why my previous post got deleted... So I posted again.
My problem with your solution was that
1) The group total still includes the "/return" amount
2) If I filter by date using slicer, february still shows "/return". But if you look at the dataset, February doesn't have return amount.- Greg_Deckler
Community Champion
Anonymous - How about these:
return =
VAR __group = MAX('Table17'[Group])
RETURN
CALCULATE(SUM(Table17[Total Sales]),Filter(ALLEXCEPT(Table17,Table17[Date]),[Item code]="/return" && [Group]=__group))
group total = CALCULATE(SUMX(FILTER(Table17,[Item code]<>"/return"),[Total Sales]),ALLEXCEPT(Table17,Table17[Group],Table17[Date]))
Very minor tweaks.
Attached again, Page 5, Table 17.
- AnonymousNot applicable
Greg_Deckler Thank you so much!! This works perfectly! I appreciate your help!!