FabCon is coming to Atlanta
Join us at FabCon Atlanta from March 16 - 20, 2026, for the ultimate Fabric, Power BI, AI and SQL community-led event. Save $200 with code FABCOMM.
Register now!- Power BI forums
- Get Help with Power BI
- Desktop
- Service
- Report Server
- Power Query
- Mobile Apps
- Developer
- DAX Commands and Tips
- Custom Visuals Development Discussion
- Health and Life Sciences
- Power BI Spanish forums
- Translated Spanish Desktop
- Training and Consulting
- Instructor Led Training
- Dashboard in a Day for Women, by Women
- Galleries
- Data Stories Gallery
- Themes Gallery
- Contests Gallery
- Quick Measures Gallery
- Notebook Gallery
- Translytical Task Flow Gallery
- TMDL Gallery
- R Script Showcase
- Webinars and Video Gallery
- Ideas
- Custom Visuals Ideas (read-only)
- Issues
- Issues
- Events
- Upcoming Events
To celebrate FabCon Vienna, we are offering 50% off select exams. Ends October 3rd. Request your discount now.
- Power BI forums
- Forums
- Get Help with Power BI
- Desktop
- Re: One visual only partially affects another visu...
- Subscribe to RSS Feed
- Mark Topic as New
- Mark Topic as Read
- Float this Topic for Current User
- Bookmark
- Subscribe
- Printer Friendly Page

- Mark as New
- Bookmark
- Subscribe
- Mute
- Subscribe to RSS Feed
- Permalink
- Report Inappropriate Content
One visual only partially affects another visual
Hi -
I couldn't find an answer to my question on other threads, so I'm starting my own.
I have a treemap visual that highlights the largest variances we see in certain cost centers, and the visual only partially affects a percent of total variance that I positioned below it. If I click one of the treemap items, it will focus to exactly the proportion it should be in percent total variance visual, but if I click a different cost center, it will revert to comparing the variance to itself, thus showing 100%. Does anyone have any idea of what may be the issue? All of the data in the queries look to be exactly the same, and I took steps to ensure so.
This is an example of the two visuals that I'm using. The top is the treemap, and the bottom is the 100% stacked bar charts. The first pic is what it looks like when nothing is selected.

This pic is what it looks like when one of the cost centers is selected in the treemap, and it filers the bar chart appropriately (the blue box in "Largest YTD Variances" is selected).
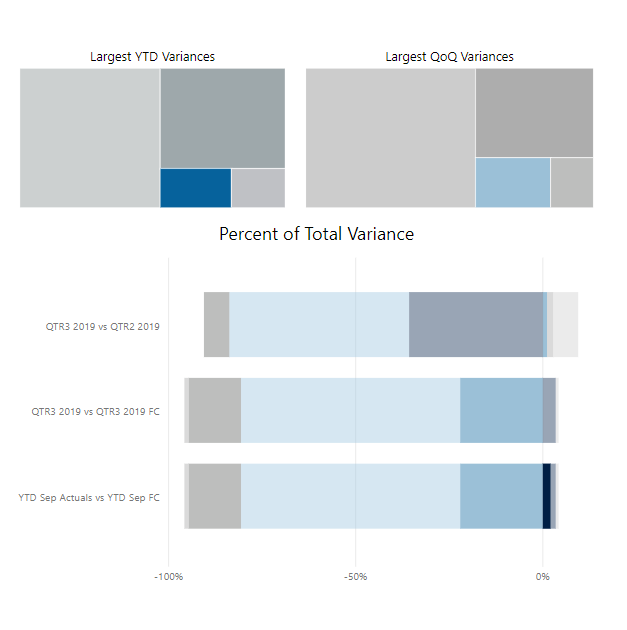
This pic is where things fall apart. For some reason if I click any of the other options on the treemap, the stacked bar chart doesn't reflect that cost center's percent as a whole (the large dark grey box in "Largest YTD Variances" is selected).

Any help would be greatly appreciated!


- Mark as New
- Bookmark
- Subscribe
- Mute
- Subscribe to RSS Feed
- Permalink
- Report Inappropriate Content
Hi @garricksullivan ,
For the original tables of the visuals above, you may change the Cross filter direction of relationships among these tables from Single to Both , which will take these tables treated as a single table.
You can learn more about relationship :https://docs.microsoft.com/en-us/power-bi/desktop-create-and-manage-relationships.
Then when you display and make selections for some fields of one table in visuals, the other linked tables' fields will return corresponding result in visuals .
Best Regards,
Amy
If this post helps, then please consider Accept it as the solution to help the other members find it more quickly.
- Mark as New
- Bookmark
- Subscribe
- Mute
- Subscribe to RSS Feed
- Permalink
- Report Inappropriate Content
Thanks for your reply!
Unfortunately, this doesn't seem to help the issue that I'm experiencing.
It's interesting and a bit confounding that two of the cost centers in the treemap work one way, and the rest don't. I've been looking at my data and I can't seem to find any difference in the fields that would make one center work over another.

- Mark as New
- Bookmark
- Subscribe
- Mute
- Subscribe to RSS Feed
- Permalink
- Report Inappropriate Content
hi garricksullivan,
think i know the problem here (i hope), when you select your tree map hover over the charts you want to be changed and you will see the symbols as shown below. the 2nd from the right (highlight) tend to be the default, you need to select the icon to the right, i.e. filter.

this should do the trick
Dave
- Mark as New
- Bookmark
- Subscribe
- Mute
- Subscribe to RSS Feed
- Permalink
- Report Inappropriate Content
Hi kinseld,
The options that you posted don't appear when I select the treemap and then hover over the other graph. I tried clicking through the options that were there, but they didn't have any effects (the only options were the filter icon which only lists what filters are affecting the visual, and the expend icon which give you a full page view of the graph)
- Mark as New
- Bookmark
- Subscribe
- Mute
- Subscribe to RSS Feed
- Permalink
- Report Inappropriate Content
- Mark as New
- Bookmark
- Subscribe
- Mute
- Subscribe to RSS Feed
- Permalink
- Report Inappropriate Content
Hi Dave - thanks for the clarification!
It looks as though I want to have highlight selected, as I think it's interesting to see the effect each section of the treemap has on the percent variance chart as a whole. Applying the filter icon as you noted makes everything come up as a 100% bar.
So now that makes me think that maybe there is something different about how the data is set up, though I'm not sure what that would be since everything looks the same in the data tables...

Helpful resources

Power BI Monthly Update - September 2025
Check out the September 2025 Power BI update to learn about new features.

Fabric Community Update - August 2025
Find out what's new and trending in the Fabric community.

| User | Count |
|---|---|
| 98 | |
| 76 | |
| 76 | |
| 48 | |
| 26 |


