- Power BI forums
- Updates
- News & Announcements
- Get Help with Power BI
- Desktop
- Service
- Report Server
- Power Query
- Mobile Apps
- Developer
- DAX Commands and Tips
- Custom Visuals Development Discussion
- Health and Life Sciences
- Power BI Spanish forums
- Translated Spanish Desktop
- Power Platform Integration - Better Together!
- Power Platform Integrations (Read-only)
- Power Platform and Dynamics 365 Integrations (Read-only)
- Training and Consulting
- Instructor Led Training
- Dashboard in a Day for Women, by Women
- Galleries
- Community Connections & How-To Videos
- COVID-19 Data Stories Gallery
- Themes Gallery
- Data Stories Gallery
- R Script Showcase
- Webinars and Video Gallery
- Quick Measures Gallery
- 2021 MSBizAppsSummit Gallery
- 2020 MSBizAppsSummit Gallery
- 2019 MSBizAppsSummit Gallery
- Events
- Ideas
- Custom Visuals Ideas
- Issues
- Issues
- Events
- Upcoming Events
- Community Blog
- Power BI Community Blog
- Custom Visuals Community Blog
- Community Support
- Community Accounts & Registration
- Using the Community
- Community Feedback
Register now to learn Fabric in free live sessions led by the best Microsoft experts. From Apr 16 to May 9, in English and Spanish.
- Power BI forums
- Forums
- Get Help with Power BI
- Desktop
- Number Appearing in Bottom Left of Line Chart when...
- Subscribe to RSS Feed
- Mark Topic as New
- Mark Topic as Read
- Float this Topic for Current User
- Bookmark
- Subscribe
- Printer Friendly Page
- Mark as New
- Bookmark
- Subscribe
- Mute
- Subscribe to RSS Feed
- Permalink
- Report Inappropriate Content
Number Appearing in Bottom Left of Line Chart when Zoom Slider used
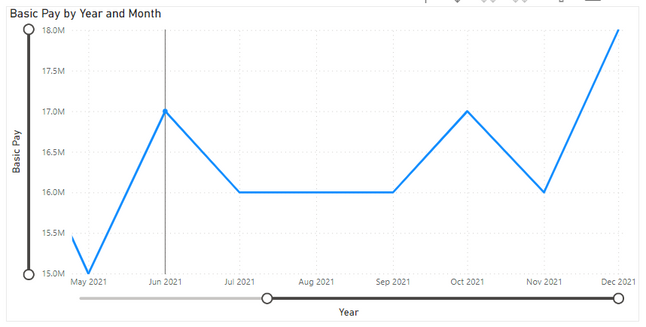
I am using a line chart to show "Basic Pay" (a number) against "Year" and "Month" (fields from a date hierarchy created from my Date field "Month and Year").
The line chart includes zoom sliders to allow the user to adjust both the X and Y axis. For example, when the graph is drilled down to Month level, the user can adjust the Month range, as shown below:
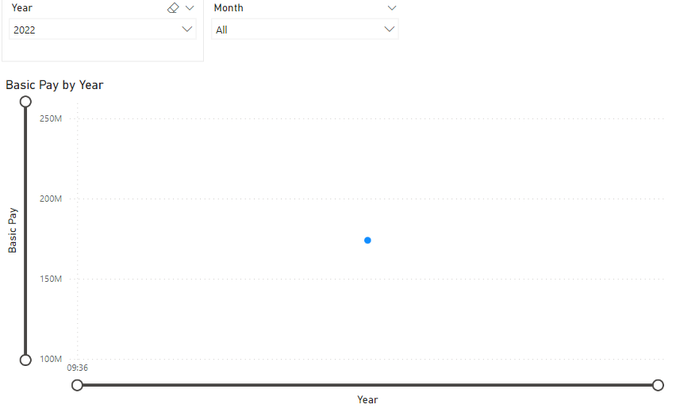
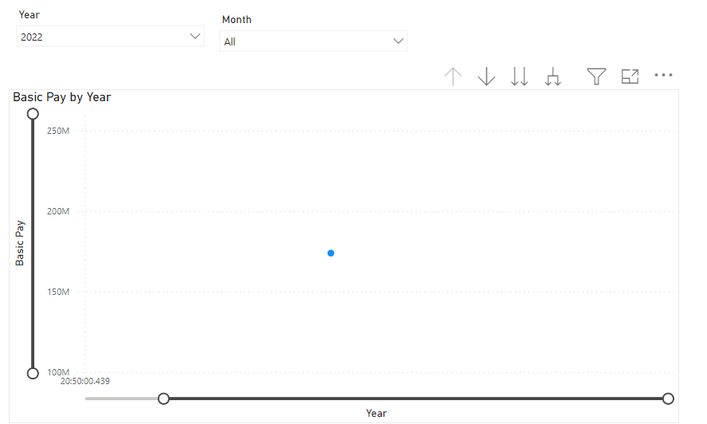
My issue is that when the graph is filtered to show only one Year when at Year level, or only one Month when drilled down into a Year, a number appears in the bottom left corner. This number changes as the axis is adjusted.
Number 09:36 appears when only 2022 is selected and graph is drilled-up to "Year" level.
Number changes to 20:50:00.439 when zoom slider adjusted
I would like to remove this number while leaving the zoom slider turned on, but I have not found a way to do this. What is causing this number to appear, and is there a way to remove it?
A link to a PBIX file containing my attempted solution can be found here: https://1drv.ms/u/s!ArNFL5h6U1zsggcYJZnBErw3AqET?e=j6qLKy
By default, the Year slicer is set to 2022 and the graph is drilled-up to Year level, as shown in the example above. Any help with this would be much appreciated.
Solved! Go to Solution.
- Mark as New
- Bookmark
- Subscribe
- Mute
- Subscribe to RSS Feed
- Permalink
- Report Inappropriate Content
Hi @Anonymous ,
Please turn off the x-axis coordinates.
Best Regards,
Neeko Tang
If this post helps, then please consider Accept it as the solution to help the other members find it more quickly.
- Mark as New
- Bookmark
- Subscribe
- Mute
- Subscribe to RSS Feed
- Permalink
- Report Inappropriate Content
- Mark as New
- Bookmark
- Subscribe
- Mute
- Subscribe to RSS Feed
- Permalink
- Report Inappropriate Content
@Anonymous Hi, I just changed the format of Month and year to short date. And added the date fields again.
The time-like number is now not showing up, hope it helps.
- Mark as New
- Bookmark
- Subscribe
- Mute
- Subscribe to RSS Feed
- Permalink
- Report Inappropriate Content
Hi @AbbasG, thank you very much for your help. However, I'm afraid that didn't resolve the issue.
When I added the date field again it appeared as you have shown, with all the months for 2022 appearing. However, by default the visual has now drilled down to Month level, and when I drill back up to Year level the number still appears. I want to be able to view the data at either Year or Month level without the number appearing.
Helpful resources

Microsoft Fabric Learn Together
Covering the world! 9:00-10:30 AM Sydney, 4:00-5:30 PM CET (Paris/Berlin), 7:00-8:30 PM Mexico City

Power BI Monthly Update - April 2024
Check out the April 2024 Power BI update to learn about new features.

| User | Count |
|---|---|
| 111 | |
| 100 | |
| 80 | |
| 64 | |
| 58 |
| User | Count |
|---|---|
| 148 | |
| 111 | |
| 93 | |
| 84 | |
| 66 |


