Jumpstart your career with the Fabric Career Hub
Find everything you need to get certified on Fabric—skills challenges, live sessions, exam prep, role guidance, and a 50 percent discount on exams.
Get started- Power BI forums
- Updates
- News & Announcements
- Get Help with Power BI
- Desktop
- Service
- Report Server
- Power Query
- Mobile Apps
- Developer
- DAX Commands and Tips
- Custom Visuals Development Discussion
- Health and Life Sciences
- Power BI Spanish forums
- Translated Spanish Desktop
- Power Platform Integration - Better Together!
- Power Platform Integrations (Read-only)
- Power Platform and Dynamics 365 Integrations (Read-only)
- Training and Consulting
- Instructor Led Training
- Dashboard in a Day for Women, by Women
- Galleries
- Community Connections & How-To Videos
- COVID-19 Data Stories Gallery
- Themes Gallery
- Data Stories Gallery
- R Script Showcase
- Webinars and Video Gallery
- Quick Measures Gallery
- 2021 MSBizAppsSummit Gallery
- 2020 MSBizAppsSummit Gallery
- 2019 MSBizAppsSummit Gallery
- Events
- Ideas
- Custom Visuals Ideas
- Issues
- Issues
- Events
- Upcoming Events
- Community Blog
- Power BI Community Blog
- Custom Visuals Community Blog
- Community Support
- Community Accounts & Registration
- Using the Community
- Community Feedback
Earn a 50% discount on the DP-600 certification exam by completing the Fabric 30 Days to Learn It challenge.
- Power BI forums
- Forums
- Get Help with Power BI
- Desktop
- Not Sure what I am doing wrong here
- Subscribe to RSS Feed
- Mark Topic as New
- Mark Topic as Read
- Float this Topic for Current User
- Bookmark
- Subscribe
- Printer Friendly Page
- Mark as New
- Bookmark
- Subscribe
- Mute
- Subscribe to RSS Feed
- Permalink
- Report Inappropriate Content
Not Sure what I am doing wrong here
Hello experts,
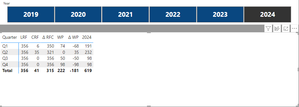
I am trying to get this layout and able to do that if I don't link my "Layout" table to "Sales" table but all the sales numbers are repeating.
but if I link those two together (Header from Layout and Sales Type from Sales) calculation is correct but delta colums disappears
This is my relationship tab looks like
and this is how Layout tables is
Measures I have

Appreciate your input in this.
Thanks
- Mark as New
- Bookmark
- Subscribe
- Mute
- Subscribe to RSS Feed
- Permalink
- Report Inappropriate Content
Was able to fix the issue where past sales were not showing based on the year selected in the slicer. It was because of the link between tables were not correct.
Still struggling to get the varinace between the sales. I used this below measure to test and it's working as long as slicer stays to "2023" but need help how I can switch to selected year in the slicer?
Thanks
- Mark as New
- Bookmark
- Subscribe
- Mute
- Subscribe to RSS Feed
- Permalink
- Report Inappropriate Content
@Baba, Can try creating a calculation group if there are measures.
Microsoft Power BI Learning Resources, 2023 !!
Learn Power BI - Full Course with Dec-2022, with Window, Index, Offset, 100+ Topics !!
Did I answer your question? Mark my post as a solution! Appreciate your Kudos !! Proud to be a Super User! !!
- Mark as New
- Bookmark
- Subscribe
- Mute
- Subscribe to RSS Feed
- Permalink
- Report Inappropriate Content
Thanks @amitchandak
Actually that option is much cleaner and less measure (again I am new to Power BI and learning new tips and tricks everyday).
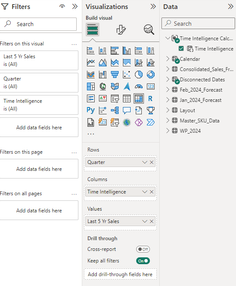
So after using "Calculation Group" (with in the power bi because I don't have Tabular Editor because of IT limitations) I am able to get (sort of) what I am after but two questions:
1. Since I am using slicer to choose the year, so I'd like to show past N years depending on which years is selected in the slicer and I can only able to get one (in this case last column on the matrix changes depending on the year).
2. Would like to show (at the very end of the matrix) change in sales depending on the year is selected in the slicer. (E.g.: if user select 2024 in the slicer, I want to show change in sales (subtraction) previous year (int his example 2023) minus slicer year (in this example 2024). same thing if 2023 is selected should show (2023 sales minus 2022) so on and so forth.
Thanks again!


