cancel
Showing results for 
Search instead for 
Did you mean: 

July 7 - July 17 | Round 2 of the Power BI Dataviz World Championships. Don't miss your chance! Learn more

Reply
vinothkumar1990
Helper II
Helper II

New table matrix data

Hi,

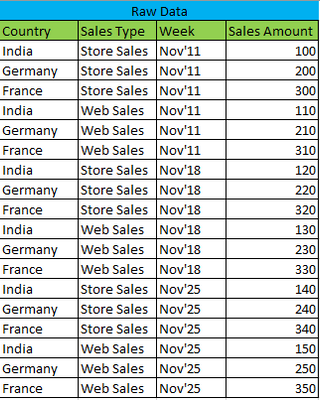
I have data in the below format.

vinothkumar1990_0-1669653559661.png


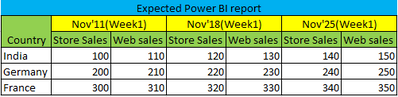
I want the report in the below format.

vinothkumar1990_1-1669653599575.png


Do we have any visuals which report in this format?


Thanks in advance!


1 ACCEPTED SOLUTION

It worked. Thanks!

View solution in original post

3 REPLIES 3
v-zhangti
Community Support
Community Support

Hi, @vinothkumar1990 


The matrix view achieves the results you expect.

vzhangti_0-1669708646088.png

No additional calculations are required.


Best Regards,

Community Support Team _Charlotte

If this post helps, then please consider Accept it as the solution to help the other members find it more quickly.

PaulDBrown
Community Champion
Community Champion

You canuse a simple matrix visual with two measures. First, set up dimension tables for Country and Sales Type using the follwoing pattern in new tables:

Country Table = 
DISTINCT(fTable[Country])

Set up a period dimension table using the follwoing:

Period Table = 
ADDCOLUMNS(
    DISTINCT(
        fTable[Week]), 
        "WeekNum", VALUE(RIGHT(fTable[Week], 2)))

You need the WeekNum field to sort the Week field by:
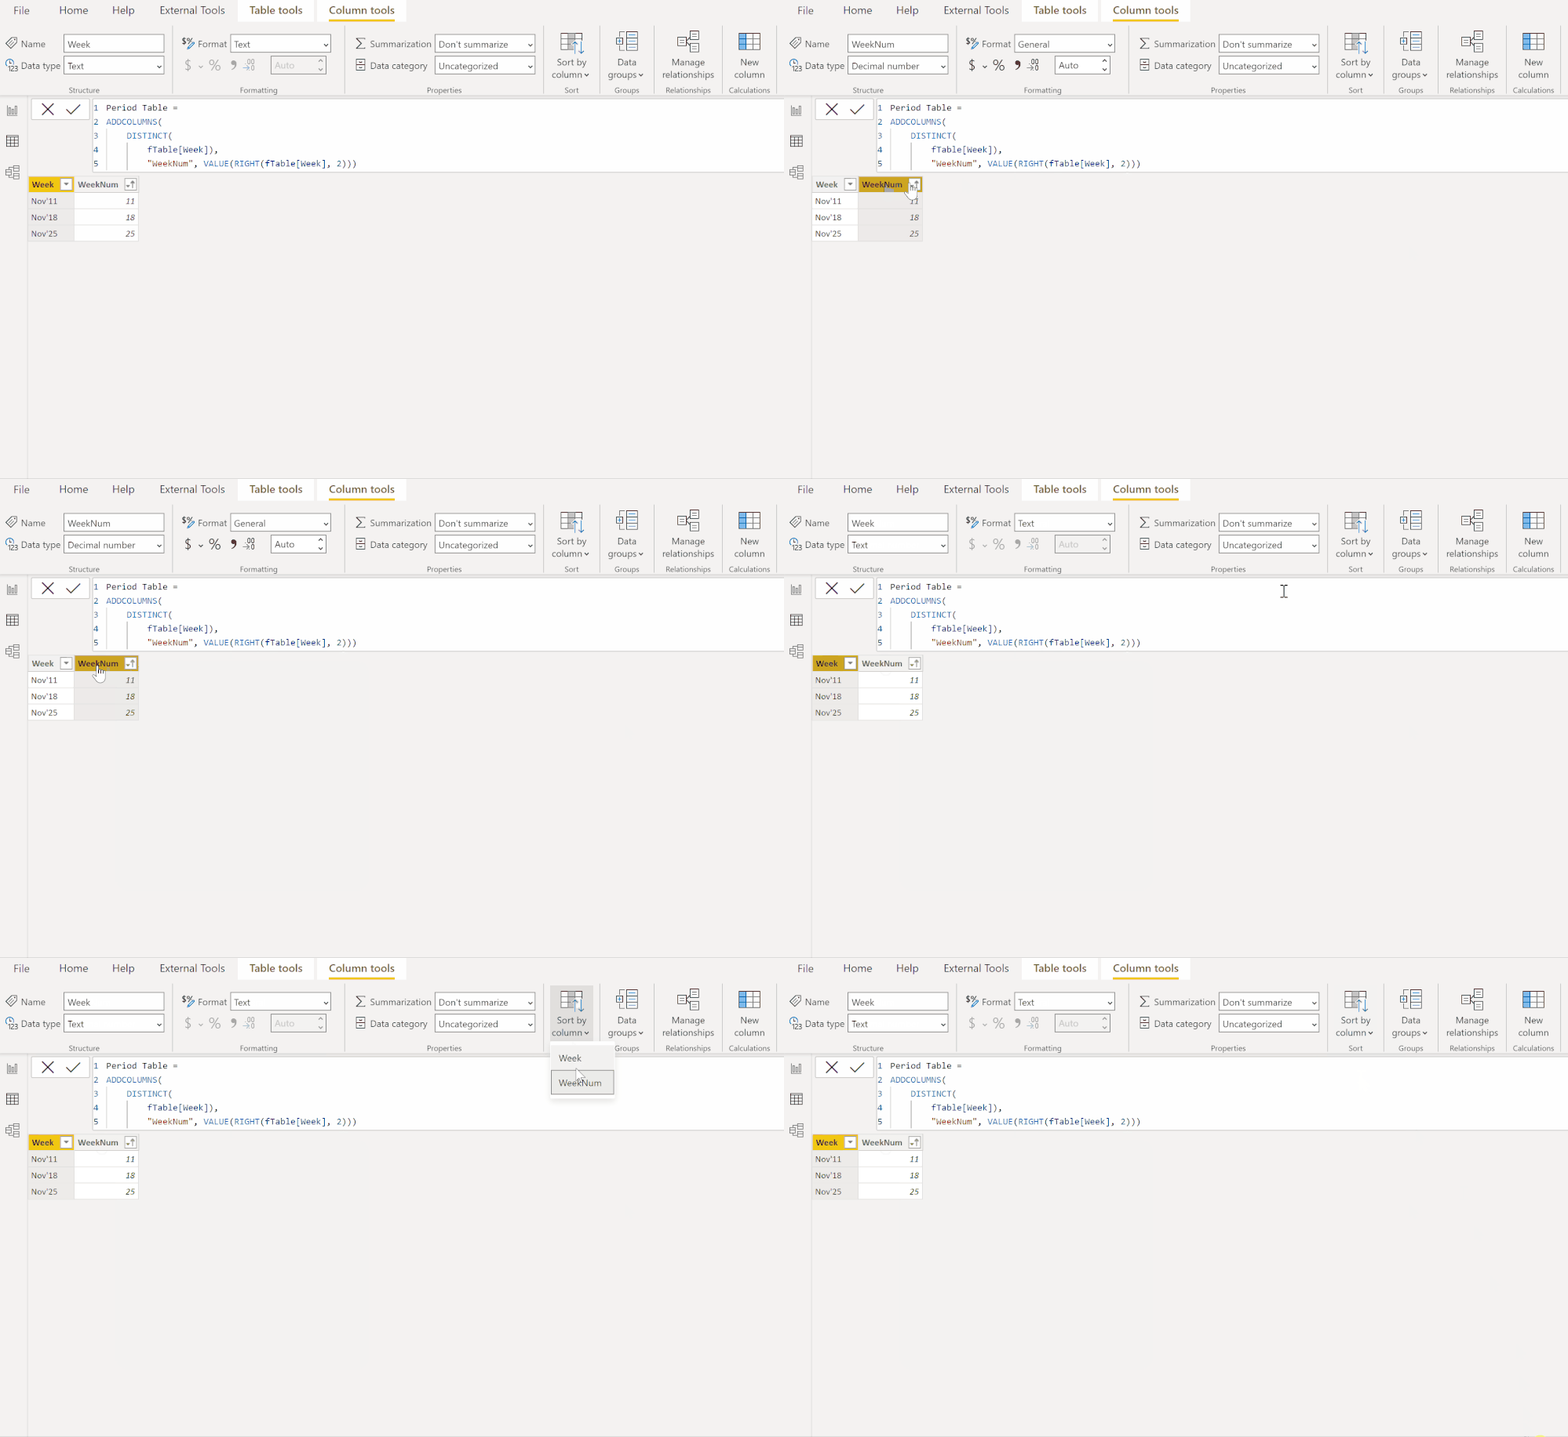
sort.gifSet up the model using one-to-many, single direction relationships between the dimension tables and the corresponding fields in the fact table:

model.jpg

Create the following two measures for the values bucket in the matrix visual:

Store Sales =
CALCULATE (
    SUM ( fTable[Sales Amount] ),
    FILTER ( 'Sales Type Table', 'Sales Type Table'[Sales Type] = "Store Sales" )
)
Web Sales =
CALCULATE (
    SUM ( fTable[Sales Amount] ),
    FILTER ( 'Sales Type Table', 'Sales Type Table'[Sales Type] = "Web Sales" )
)

Now you can set up the matrix as follows:
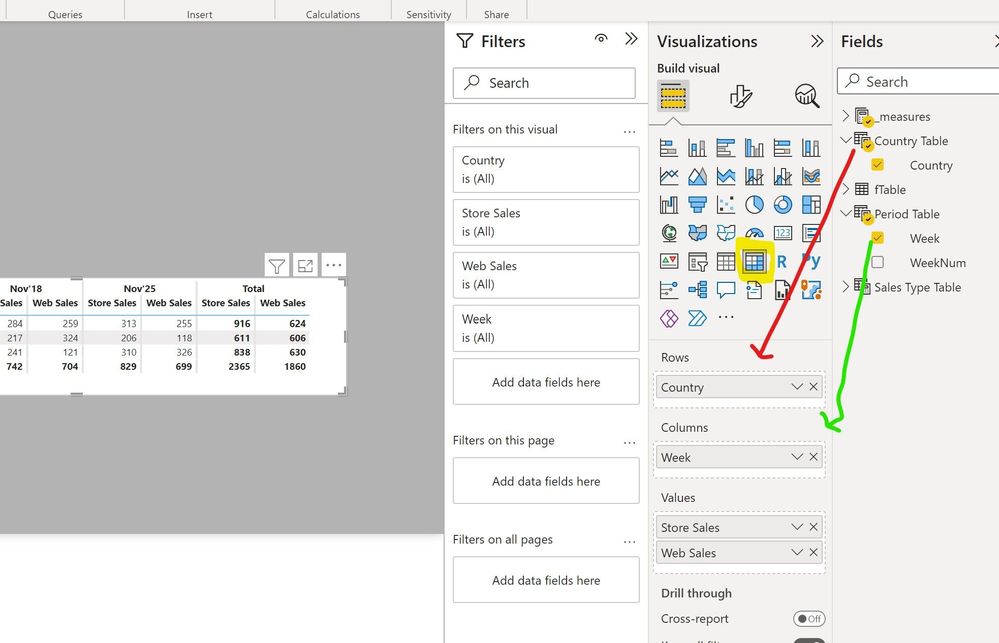
matrix.jpgresult.jpg


Sample PBIX file attached


Did I answer your question? Mark my post as a solution!
In doing so, you are also helping me. Thank you!

Proud to be a Super User!
Paul on Linkedin.


It worked. Thanks!

Helpful resources

Announcements
FabCon and SQLCon Barcelona 2026

FabCon & SQLCon – Barcelona 2026

Join us in Barcelona for FabCon and SQLCon, the Fabric, Power BI, SQL, and AI community event. Save €200 with code FABCMTY200.

60 days of Data Days Carousel

Data Days 2026

Join Fabric Data Days 2026: 60 days of free live/on-demand sessions, challenges, study groups, and certification opportunities.

Power BI DataViz World Championships carousel

Power BI DataViz World Championships - June 2026

A new Power BI DataViz World Championship is coming this June! Don't miss out on submitting your entry.

Top Solution Authors