Fabric Data Days starts November 4th!
Advance your Data & AI career with 50 days of live learning, dataviz contests, hands-on challenges, study groups & certifications and more!
Get registered- Power BI forums
- Get Help with Power BI
- Desktop
- Service
- Report Server
- Power Query
- Mobile Apps
- Developer
- DAX Commands and Tips
- Custom Visuals Development Discussion
- Health and Life Sciences
- Power BI Spanish forums
- Translated Spanish Desktop
- Training and Consulting
- Instructor Led Training
- Dashboard in a Day for Women, by Women
- Galleries
- Data Stories Gallery
- Themes Gallery
- Contests Gallery
- Quick Measures Gallery
- Visual Calculations Gallery
- Notebook Gallery
- Translytical Task Flow Gallery
- TMDL Gallery
- R Script Showcase
- Webinars and Video Gallery
- Ideas
- Custom Visuals Ideas (read-only)
- Issues
- Issues
- Events
- Upcoming Events
Get Fabric Certified for FREE during Fabric Data Days. Don't miss your chance! Learn more
- Power BI forums
- Forums
- Get Help with Power BI
- Desktop
- Re: Moving Average over weeks using a measure and ...
- Subscribe to RSS Feed
- Mark Topic as New
- Mark Topic as Read
- Float this Topic for Current User
- Bookmark
- Subscribe
- Printer Friendly Page
- Mark as New
- Bookmark
- Subscribe
- Mute
- Subscribe to RSS Feed
- Permalink
- Report Inappropriate Content
Moving Average over weeks using a measure and a datedim
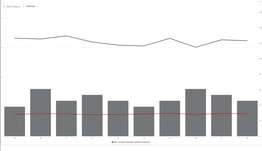
Hi! I'm designing a visualization on which I'd like to show a 4 week over of a measure.
The moving average will be based on the 'Berth Productivity' line which uses the following measure:
Solved! Go to Solution.
- Mark as New
- Bookmark
- Subscribe
- Mute
- Subscribe to RSS Feed
- Permalink
- Report Inappropriate Content
Hi @Anonymous
Assume you have data as below
| date | value |
| 2019070103 | 1 |
| 2019070203 | 2 |
| 2019070303 | 3 |
Open edit queries,
Add a column
let
    Source = Excel.Workbook(File.Contents("C:\Users\maggiel\Desktop\case\7\7.23\7.23.xlsx"), null, true),
    Sheet4_Sheet = Source{[Item="Sheet4",Kind="Sheet"]}[Data],
    #"Promoted Headers" = Table.PromoteHeaders(Sheet4_Sheet, [PromoteAllScalars=true]),
    #"Changed Type" = Table.TransformColumnTypes(#"Promoted Headers",{{"date", Int64.Type}, {"value", Int64.Type}}),
    #"Inserted Merged Column" = Table.AddColumn(#"Changed Type", "Merged_date", each Text.Combine({Text.Start(Text.From([date], "en-US"), 4), Text.Middle(Text.From([date], "en-US"), 4, 2), Text.Middle(Text.From([date], "en-US"), 6, 2)}, "/"), type text),
    #"Changed Type1" = Table.TransformColumnTypes(#"Inserted Merged Column",{{"Merged_date", type date}})
in
    #"Changed Type1"
Close&&Apply
Create new tables
calendar = ADDCOLUMNS(CALENDARAUTO(),"year",YEAR([Date]),"month",MONTH([Date]),"weeknum",WEEKNUM([Date],2))
weekset = VALUES('calendar'[weeknum])
Create measures
selected_weeknumber = SELECTEDVALUE(weekset[weeknum])

current_week = WEEKNUM(TODAY(),2)

last week = [current_week]-[selected_weeknumber]

clc_sum =
VAR clc_value =
    CALCULATE (
        SUM ( Sheet4[value] ),
        FILTER (
            ALLSELECTED ( Sheet4 ),
            Sheet4[Merged_date] <= MAX ( Sheet4[Merged_date] )
                && WEEKNUM ( Sheet4[Merged_date], 2 ) < [current_week]
                && WEEKNUM ( Sheet4[Merged_date], 2 ) >= [last week]
        )
    )
RETURN
    IF ( MAX ( 'calendar'[weeknum] ) = [current_week], BLANK (), clc_value )

clc_average = [clc_sum]/[selected_weeknumber]
Best Regards
Maggie
Community Support Team _ Maggie Li
If this post helps, then please consider Accept it as the solution to help the other members find it more quickly.
- Mark as New
- Bookmark
- Subscribe
- Mute
- Subscribe to RSS Feed
- Permalink
- Report Inappropriate Content
Hi @Anonymous
Could you show an example of datedim and 'Results' table?
Can i connect them via "date"(eg.20190716) field?
Here is a useful link you could refer to
Moving Averages Controlled by Slicer
Best Regards
Maggie
Community Support Team _ Maggie Li
If this post helps, then please consider Accept it as the solution to help the other members find it more quickly.
- Mark as New
- Bookmark
- Subscribe
- Mute
- Subscribe to RSS Feed
- Permalink
- Report Inappropriate Content
You can indeed use that key to link to the datedim.
Here're some of the relevant columns.
Helpful resources

Fabric Data Days
Advance your Data & AI career with 50 days of live learning, contests, hands-on challenges, study groups & certifications and more!

Power BI Monthly Update - October 2025
Check out the October 2025 Power BI update to learn about new features.


