- Power BI forums
- Updates
- News & Announcements
- Get Help with Power BI
- Desktop
- Service
- Report Server
- Power Query
- Mobile Apps
- Developer
- DAX Commands and Tips
- Custom Visuals Development Discussion
- Health and Life Sciences
- Power BI Spanish forums
- Translated Spanish Desktop
- Power Platform Integration - Better Together!
- Power Platform Integrations (Read-only)
- Power Platform and Dynamics 365 Integrations (Read-only)
- Training and Consulting
- Instructor Led Training
- Dashboard in a Day for Women, by Women
- Galleries
- Community Connections & How-To Videos
- COVID-19 Data Stories Gallery
- Themes Gallery
- Data Stories Gallery
- R Script Showcase
- Webinars and Video Gallery
- Quick Measures Gallery
- 2021 MSBizAppsSummit Gallery
- 2020 MSBizAppsSummit Gallery
- 2019 MSBizAppsSummit Gallery
- Events
- Ideas
- Custom Visuals Ideas
- Issues
- Issues
- Events
- Upcoming Events
- Community Blog
- Power BI Community Blog
- Custom Visuals Community Blog
- Community Support
- Community Accounts & Registration
- Using the Community
- Community Feedback
Register now to learn Fabric in free live sessions led by the best Microsoft experts. From Apr 16 to May 9, in English and Spanish.
- Power BI forums
- Forums
- Get Help with Power BI
- Desktop
- More months on Bar Graph than on Slicer
- Subscribe to RSS Feed
- Mark Topic as New
- Mark Topic as Read
- Float this Topic for Current User
- Bookmark
- Subscribe
- Printer Friendly Page
- Mark as New
- Bookmark
- Subscribe
- Mute
- Subscribe to RSS Feed
- Permalink
- Report Inappropriate Content
More months on Bar Graph than on Slicer
Hi,
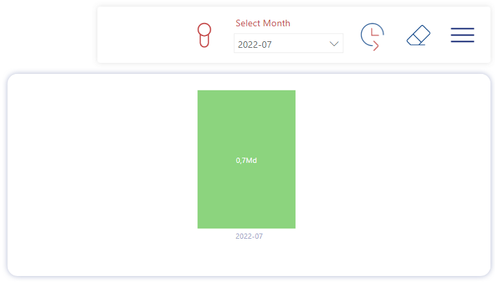
I have a dashboard with a date slicer used to select one month.
I also have a Bar Graph that displays the agregated value for this particular month. The value comes from a measure copied at the end of this post.
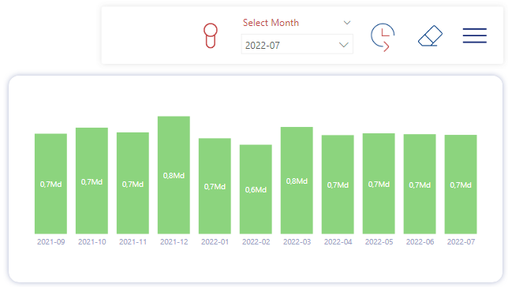
--> I want to select a single month on the slicer and have my Bar Graph show the results for the selected month + 11 months prior.
For instance if the slicer is set to 2022-07, I want the graph to show results from 2021-08 to 2022-07. And if the slicer is changed to 2021-12, I want the graph to show results from 2021-01 to 2021-12. The results would look like the screenshot below, obtained via forcing the date range in a filter in the graph and disconnecting interaction between slicer and graph.
I can't get my head around expanding the date range filtered by a slicer and using it in a graph... Someone knows how to do this ?
Bar Graph X-Axis on the graph is a calculated column from my dates table, with endofmonth dax formula.
Bar Graph Y-Axis comes from this measure, a bit complex because it manages different agregations according to a parameter table (T_FIL_PARAM_INDIC) :
VALUE = VAR COES = MAX(T_FIL_PARAM_INDIC[CD_EDS]) VAR INDIC = SUBSTITUTE(MAX(T_FIL_PARAM_INDIC[CO_INDIC]),"_EFF","") RETURN IF(DISTINCTCOUNT(T_FIL_PARAM_INDIC[LIBELLE_INDIC])>1,BLANK(), IF( MAX(T_FIL_PARAM_INDIC[AGREGAT]) = "Somme", SUM(T_FIL_COMPLET_Q[NUM])+0, IF( MAX(T_FIL_PARAM_INDIC[AGREGAT]) = "Ratio", DIVIDE(SUM(T_FIL_COMPLET_Q[NUM]),SUM(T_FIL_COMPLET_Q[DENOM]))*100+0, IF( MAX(T_FIL_PARAM_INDIC[AGREGAT]) = "Moyenne", DIVIDE(SUM(T_FIL_COMPLET_Q[NUM]),SUM(T_FIL_COMPLET_Q[DENOM]))+0, IF( MAX(T_FIL_PARAM_INDIC[AGREGAT]) = "Stock", CALCULATE(SUM(T_FIL_COMPLET_Q[NUM]), LASTDATE(T_FIL_COMPLET_Q[DTJOUR]))+0, IF( MAX(T_FIL_PARAM_INDIC[AGREGAT]) = "Efficience", DIVIDE( CALCULATE(SUM(T_FIL_COMPLET_Q[NUM]), ALL(T_FIL_PARAM_INDIC[LIBELLE_INDIC],T_FIL_PARAM_INDIC[FREQUENCE],T_FIL_PARAM_INDIC[RANG]),T_FIL_PARAM_INDIC[CO_INDIC] = INDIC), CALCULATE(SUM(T_FIL_COMPLET_Q[NUM]), ALL(T_FIL_PARAM_INDIC[LIBELLE_INDIC],T_FIL_PARAM_INDIC[FREQUENCE],T_FIL_PARAM_INDIC[RANG]),T_FIL_PARAM_INDIC[CO_INDIC] = "TR_" & COES & "_RH_01") )+0 )))))) |
Solved! Go to Solution.
- Mark as New
- Bookmark
- Subscribe
- Mute
- Subscribe to RSS Feed
- Permalink
- Report Inappropriate Content
Hi there!
You can refer to this video/post from SQLBI.
https://www.youtube.com/watch?v=d8Rm7dwM6gc
Let me know if that helps!
- Mark as New
- Bookmark
- Subscribe
- Mute
- Subscribe to RSS Feed
- Permalink
- Report Inappropriate Content
Hi there!
You can refer to this video/post from SQLBI.
https://www.youtube.com/watch?v=d8Rm7dwM6gc
Let me know if that helps!
- Mark as New
- Bookmark
- Subscribe
- Mute
- Subscribe to RSS Feed
- Permalink
- Report Inappropriate Content
Hi Pablo,
Thanks for the video, it's very close to what I'm looking for!
Now my chart show the 12 months I want, but it includes the names of all months available in my dates tables...
Any idea why ?
Thanks,
Antoine
- Mark as New
- Bookmark
- Subscribe
- Mute
- Subscribe to RSS Feed
- Permalink
- Report Inappropriate Content
Not sure exactly why that is happening, is it possible that one of your measures has a "+0" somewhere? If not, check the filter pane, it might be possible to remove those values from there.
- Mark as New
- Bookmark
- Subscribe
- Mute
- Subscribe to RSS Feed
- Permalink
- Report Inappropriate Content
Yeah i just double checked the measure above, the +0 on it might be the reason.
- Mark as New
- Bookmark
- Subscribe
- Mute
- Subscribe to RSS Feed
- Permalink
- Report Inappropriate Content
Removed the 0 and it works like a charm, thanks again !
Helpful resources

Microsoft Fabric Learn Together
Covering the world! 9:00-10:30 AM Sydney, 4:00-5:30 PM CET (Paris/Berlin), 7:00-8:30 PM Mexico City

Power BI Monthly Update - April 2024
Check out the April 2024 Power BI update to learn about new features.

| User | Count |
|---|---|
| 105 | |
| 105 | |
| 88 | |
| 73 | |
| 66 |
| User | Count |
|---|---|
| 124 | |
| 113 | |
| 98 | |
| 81 | |
| 72 |


