FabCon is coming to Atlanta
Join us at FabCon Atlanta from March 16 - 20, 2026, for the ultimate Fabric, Power BI, AI and SQL community-led event. Save $200 with code FABCOMM.
Register now!- Power BI forums
- Get Help with Power BI
- Desktop
- Service
- Report Server
- Power Query
- Mobile Apps
- Developer
- DAX Commands and Tips
- Custom Visuals Development Discussion
- Health and Life Sciences
- Power BI Spanish forums
- Translated Spanish Desktop
- Training and Consulting
- Instructor Led Training
- Dashboard in a Day for Women, by Women
- Galleries
- Data Stories Gallery
- Themes Gallery
- Contests Gallery
- QuickViz Gallery
- Quick Measures Gallery
- Visual Calculations Gallery
- Notebook Gallery
- Translytical Task Flow Gallery
- TMDL Gallery
- R Script Showcase
- Webinars and Video Gallery
- Ideas
- Custom Visuals Ideas (read-only)
- Issues
- Issues
- Events
- Upcoming Events
The Power BI Data Visualization World Championships is back! Get ahead of the game and start preparing now! Learn more
- Power BI forums
- Forums
- Get Help with Power BI
- Desktop
- Re: Month Columns in PBI Desktop vs PBI Online
- Subscribe to RSS Feed
- Mark Topic as New
- Mark Topic as Read
- Float this Topic for Current User
- Bookmark
- Subscribe
- Printer Friendly Page


- Mark as New
- Bookmark
- Subscribe
- Mute
- Subscribe to RSS Feed
- Permalink
- Report Inappropriate Content
Month Columns in PBI Desktop
I noticed that when I load my data directly into PBI Online I automatically get YEAR and MONTH columns added next to all DATE columns I have! What is even better is that this MONTH column that PBI Online only adds for me automatically is formatted (January, February, etc...) and the month names actually sort properly - (January, February, and so on). Is this feature coming to PBI Desktop? Or does anyone know how to create a month column the same way so that it shows the MONTH names but most importantly sorts in the correct order (not April, August, and so on). I know how to do this with Excel PowerPivot Tables with the custom sort dialog-box but can't seem to find it in PBI Desktop? I wonder if this is done with DAX or M? Thanks!
Solved! Go to Solution.


- Mark as New
- Bookmark
- Subscribe
- Mute
- Subscribe to RSS Feed
- Permalink
- Report Inappropriate Content
We're currently working on this for the desktop .... and it will be a unified experience in both the desktop and service. There are several date time features that will show up. This kind of automatic behavior is among the first that will arrive.
- Mark as New
- Bookmark
- Subscribe
- Mute
- Subscribe to RSS Feed
- Permalink
- Report Inappropriate Content
I am too having this issue, surly it is a basic problem?
- Mark as New
- Bookmark
- Subscribe
- Mute
- Subscribe to RSS Feed
- Permalink
- Report Inappropriate Content
Thanks! That would be great and would save us time when dealing with all date columns in a data model. Looking forward to it!


- Mark as New
- Bookmark
- Subscribe
- Mute
- Subscribe to RSS Feed
- Permalink
- Report Inappropriate Content
@Sean You can create a calculted column for your date field as follows:
~MonthNumber=Month([Created Date])
Where MonthNumber is used to extract month number. Then later
~Month=SWITCH([MonthNumber],
1,"January",
2,"Feburary",
3,"March",
4,"April",
5,"May",
6,"June",
7,"July",
8,"August",
9,"September",
10,"October",
11,"November",
12,"December",
"Invalid Month Number"
)
To represents Month in Words
~MonthNo=SWITCH([MonthNumber],
1,"01",
2,"02",
3,"03",
4,"04",
5,"05",
6,"06",
7,"07",
8,"08",
9,"09",
10,"10",
11,"11",
12,"12"
)
~Year=YEAR([Created Date])
~YearMonth=[Year]&[MonthNo]
For custom sorting the month column.
Later to sort, you can follow the following step as shown in image below and also the sorted filed
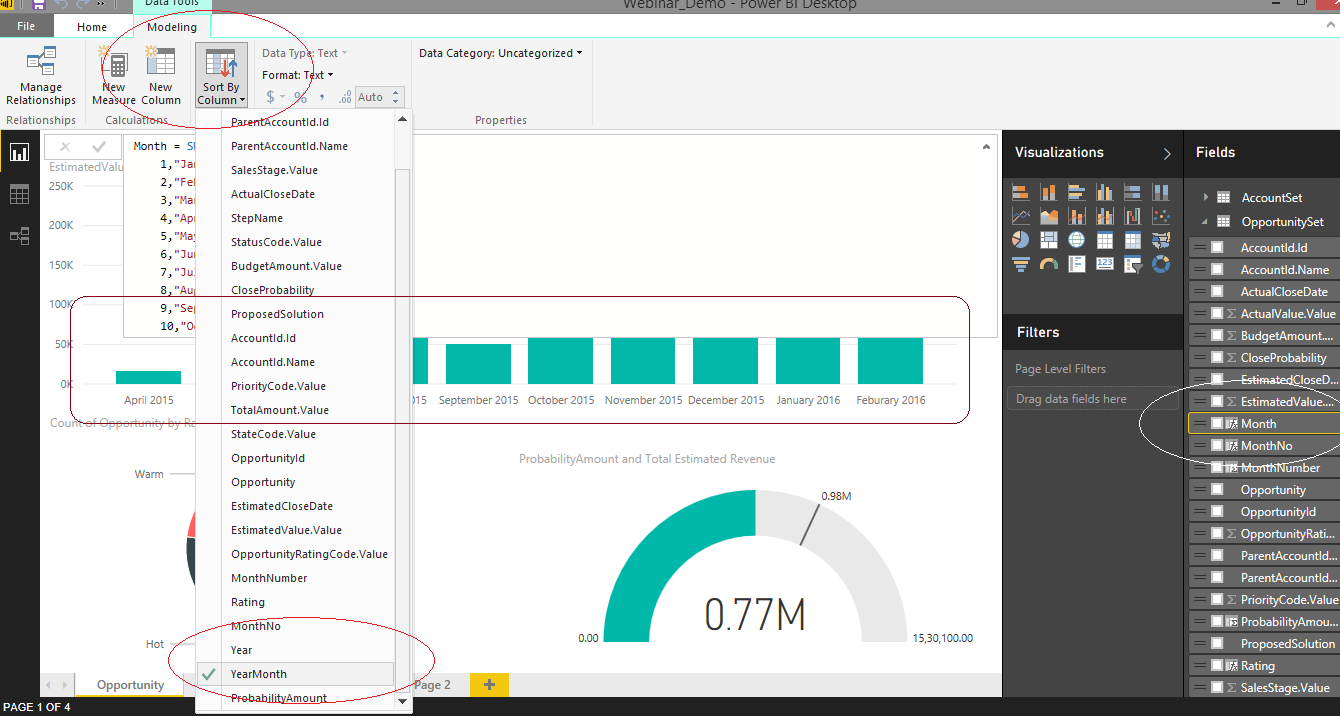
You can see the output marked in rectangle. Hope this works!

- Mark as New
- Bookmark
- Subscribe
- Mute
- Subscribe to RSS Feed
- Permalink
- Report Inappropriate Content
How can you setup this sort for just month? Without the Month & Year?


- Mark as New
- Bookmark
- Subscribe
- Mute
- Subscribe to RSS Feed
- Permalink
- Report Inappropriate Content
Yup, RJ's explanation is exactly like I did it - use a helper column with a numerical value and use that as the "Sort As" column.
- Mark as New
- Bookmark
- Subscribe
- Mute
- Subscribe to RSS Feed
- Permalink
- Report Inappropriate Content
ALeef
Have you had a look at my explantion to join two or more dates to one calendar
I was confused at first so wrote it down in detail
- Mark as New
- Bookmark
- Subscribe
- Mute
- Subscribe to RSS Feed
- Permalink
- Report Inappropriate Content
@RJ : Yup! Thats exactly how I did it, good write up.
It ended up not being exactly what I needed for my visualization, but its a really useful way of doing it.
- Mark as New
- Bookmark
- Subscribe
- Mute
- Subscribe to RSS Feed
- Permalink
- Report Inappropriate Content
raprgz
Unsure if this helps or not
http://community.powerbi.com/t5/Desktop/Sorting-by-Month-as-Text-Jan-Feb-Mar-etc/m-p/9244#M1730
This is the way I sorted Jan Feb Mar etc by the month number
I was confused at first so have given a fairly detailed step by step explanation

- Mark as New
- Bookmark
- Subscribe
- Mute
- Subscribe to RSS Feed
- Permalink
- Report Inappropriate Content
Create a new column called "MonthSort" or something and use the formula:
=FORMAT([Date],"mm")
This will give you a two digit number for month.
Select your Month column, Modeling tab and choose "Sort by Column" and set it to MonthSort column.
Follow on LinkedIn
@ me in replies or I'll lose your thread!!!
Instead of a Kudo, please vote for this idea
Become an expert!: Enterprise DNA
External Tools: MSHGQM
YouTube Channel!: Microsoft Hates Greg
Latest book!: DAX For Humans
DAX is easy, CALCULATE makes DAX hard...

- Mark as New
- Bookmark
- Subscribe
- Mute
- Subscribe to RSS Feed
- Permalink
- Report Inappropriate Content
I wanted to compare months for several years side-by-side in plots, so I created a new variable MMYYYY for sorting purposes:
MMYYYY = FORMAT('Calendar'[calendar_nk],"MM-yyyy")
PowerBI tells me this computed field is a text type, as expected.
After I sort this new column, the dates are not in the text order I'm expecting.
I see:
First entry:
07-2015
Last entry
06-2014
The order of some middle entries doesn't make any sense to me, e.g., ... 12-2016, 04-2017, 06-2017, 01-2017 ...
I'm expecting the order to be something like 01-2014, 01-2015, 01-2016 .... 12-2014, 12-2015, 12-2016
How do I order data for a visualization in MM-YYYY text order?
- Mark as New
- Bookmark
- Subscribe
- Mute
- Subscribe to RSS Feed
- Permalink
- Report Inappropriate Content
I tried a numbers only approach and I still couldn't get "sort by column" to work:
MMYYYY = 10000*'Calendar'[month_num] + 'Calendar'[year_num]
Why doesn't "Sort by Columns" give some sort of diagnostic message when it refuses to sort a column?


- Mark as New
- Bookmark
- Subscribe
- Mute
- Subscribe to RSS Feed
- Permalink
- Report Inappropriate Content
What happens when you follow the instructions as given in my last post? Did you try that approach? The formula works, the sorting works. The screenshot shows it.
- Mark as New
- Bookmark
- Subscribe
- Mute
- Subscribe to RSS Feed
- Permalink
- Report Inappropriate Content
Thank you for your reply. I tried to create what you suggested:
DateSort =Date.ToText(‘Calendar’[full_date],"yyyyMM")
But I see: The syntax for '.' is incorrect. (DAX(Date.ToText('Calendar'[calendar_nk,"yyyyMM"))).
I'm not sure why the "M" formula does not work here, but this does what I think you suggested:
DateSort = FORMAT('Calendar'[calendar_nk],"yyyyMM")
But I still cannot "Sort by Column" after creating the new DateSort column. As far as I can tell, Sort by Column silently does nothing.
Perhaps my problem is my data model is not a single table (query). I'm working with 17 tables that are inter-connected. For some reason, I cannot sort my Calendar table to create the graphic order I want. The main table with the data of interest has 7 relationships with other tables in addition to the Calendar table.
Is it possible PowerBI wants the whole data model re-ordered to create a graphic, and PowerBI for some reason won’t sort my Calendar table?
I am new to PowerBi, but know R much better. In R, one can extract data and re-order it if necessary to create a graphic without changing the order in the original data source. Is PowerBI not as flexible? In PowerBI is it possible to change the order for a visualization without changing the order of the original data?
- Mark as New
- Bookmark
- Subscribe
- Mute
- Subscribe to RSS Feed
- Permalink
- Report Inappropriate Content
Why is that not working for me? My column "CreatedDate" is a date column. But when I use the formula
=FORMAT([CreatedDate],"yyyymm")
I get an error "the name 'FORMAT' wasn't recognized. Make sure it's spelled correctly.

- Mark as New
- Bookmark
- Subscribe
- Mute
- Subscribe to RSS Feed
- Permalink
- Report Inappropriate Content
OK, found it. The FORMAT function is a DAX function, not an M function. It would be a lot easier if people would point that out when posting a formula.
If you want to create the column in M, then use
=Date.ToText([CreatedDate],"yyyyMM")
With lower case yyyy and uppercase MM.

- Mark as New
- Bookmark
- Subscribe
- Mute
- Subscribe to RSS Feed
- Permalink
- Report Inappropriate Content
Thanks for your answer. It worked for me.
I am just asking myself why it doesn't work when you have 2 digits for a month number column.
Thanks in advance.


- Mark as New
- Bookmark
- Subscribe
- Mute
- Subscribe to RSS Feed
- Permalink
- Report Inappropriate Content
Please give solution for direct query. I don't load data in Power BI.
I directly generate Power BI report from cube.
- Mark as New
- Bookmark
- Subscribe
- Mute
- Subscribe to RSS Feed
- Permalink
- Report Inappropriate Content
this does not support in direct query mode
- Mark as New
- Bookmark
- Subscribe
- Mute
- Subscribe to RSS Feed
- Permalink
- Report Inappropriate Content
I'm actually trying to sort the Month NAMES (January, February, March, and so on) correctly.
I have a column named Check Date and also a column Sale Date in one of my data sources!
When I load that data in PBI ONLINE NOT in PBI desktop I automatically get Check YEAR and Check MONTH Columns added!
And also Sale YEAR and Sale MONTH columns added.
So these 4 columns get created for me automatically! (Has anyone else seen this with PBI Online only)
Both the Check MONTH and the Sale MONTH columns that get automatically created => list the months by their names and
Most importantly both of these columns then SORT - January, February, March.... meaning in the correct order!
If I had not seen this in PBI Online I would still be using the numbers for the months.
I'm just wondering if anyone knows how to do this in PBI Desktop using either DAX or M?
If I create a column using => FORMAT(Payments[Check Date], "MMMM") => Month names will sort alphabetically and not in the correct order! (In PowerPivot Tables you could go to a Custom Sort and select Jan, Feb, etc.. Sort)

- Mark as New
- Bookmark
- Subscribe
- Mute
- Subscribe to RSS Feed
- Permalink
- Report Inappropriate Content
1) What is your data source for the information you are pulling in?
2) The way you do this is to create a yearmonth calculated column and sort your month on that. This functionality exists in the PBI Desktop and Excel. Highlight the field you want sorted, and select "Sort by Column" and select your numeric column. Then things will sort the way you want.
This older blog by @marcorusso is still relevant to you question.
Are you the owner of the data set? It almost sounds like someone created these sorting fields for you in the dataset...
Looking for more Power BI tips, tricks & tools? Check out PowerBI.tips the site I co-own with Mike Carlo. Also, if you are near SE WI? Join our PUG Milwaukee Brew City PUG
- Mark as New
- Bookmark
- Subscribe
- Mute
- Subscribe to RSS Feed
- Permalink
- Report Inappropriate Content
Month and Year Columns get automatically created in PBI Online for all Date Columns???
Has anyone else seen this? Hope this feature is coming soon to PBI Desktop.
Please test for yourself to see what I mean.
STEP 1 => create a simple Excel file with 1 table called Payments (even with local file works)
Payments table
Company Check Date Property Sale Date Sale Price
Company 1 1/1/2015 Prop 1 Nov-14 $1.00
Company 2 2/15/2015 Prop 2 Dec-14 $1.00
Company 3 4/1/2015 Prop 3 Jan-15 $1.00
Company 4 5/16/2015 Prop 4 Feb-15 $1.00
Company 5 6/30/2015 Prop 5 Mar-15 $1.00
Company 6 8/14/2015 Prop 6 Apr-15 $1.00
Company 7 9/28/2015 Prop 7 May-15 $1.00
Company 8 11/12/2015 Prop 8 Jun-15 $1.00
Company 9 12/27/2015 Prop 9 Jul-15 $1.00
Company 10 2/10/2016 Prop 10 Aug-15 $1.00
STEP 2 => Log in POWER BI Online
STEP 3 => Get Data => Local File => select the sample file
STEP 4 => Explore the new dataset
STEP 5 => Look at the fields => 4 new columns are automatically created => Check Month / Check Year & Sale Month / Sale Year
STEP 6 => Select the newly created by PBI Online Check Month column
NOTE => It sorts the Month NAMES (not numbers) CORRECTLY not alphabetically
Follow same procedure in PBI Desktop => those 4 extra columns from STEP 5 do not show up!
In my original file PBI Desktop file I have to create those 4 columns and I do also have a YYYY-MM column for other visualizations. But I use numbers for the months. I use Check Year as a slicer and Check Month on the horizotal axis. This lets me draw individual lines for the selected in the slicer year(s) to see seasonal trends. Basically compare 2014 (Jan thru Dec) vs any other year(s) (Jan thru Dec) you select from the slicer.
I stumbled onto this when loading a file directly online!
I just want to find out how to create a column in PBI Desktop (with DAX or M) that sorts Month NAMES (not numbers) the same way they sort in PBI Online!
Thanks!

Helpful resources

Power BI Dataviz World Championships
The Power BI Data Visualization World Championships is back! Get ahead of the game and start preparing now!

Power BI Monthly Update - December 2025
Check out the December 2025 Power BI Holiday Recap!

FabCon Atlanta 2026
Join us at FabCon Atlanta, March 16-20, for the ultimate Fabric, Power BI, AI and SQL community-led event. Save $200 with code FABCOMM.

| User | Count |
|---|---|
| 39 | |
| 37 | |
| 33 | |
| 32 | |
| 29 |


| User | Count |
|---|---|
| 132 | |
| 88 | |
| 82 | |
| 68 | |
| 64 |


