Forum Discussion

Median Calculation in Table Visualization
Hello All,
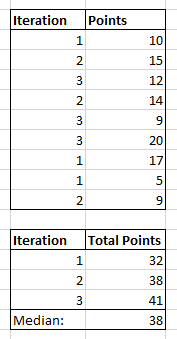
I have a table which has iteration and points covered in each iteration as shown below. I need to group the table as shown in figure 2. The second table contains distinct iterations and total points covered in that iteration. I have calculated the median and percent(Divided total points of each iteration by the median calculated) as follows:
Media =
MEDIANX (
    SUMMARIZE ( Data, Data[Iteration] ),
    CALCULATE ( SUM ( Data[Points] ) )
)
Percent = DIVIDE ( SUM ( Data[Points] ), CALCULATE ( [Media], ALLSELECTED ( Data ) ) )
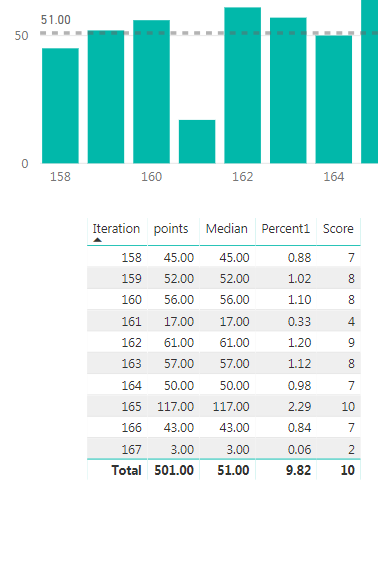
In my actual table there are many iterations and I need to display the top 6 iterations and get the score for them. The above calculation works if ALL(Data) is used instead of ALLSELECTED(Data). However, in my graph visualization(Custom Column Chart), upon selecting a particular iteration,the value of percent changes to 1 for all iterations.

Hoping you could help out here.
Thanks,
Prashasti
4 Replies
- AlBCommunity Champion
Hi Prashasti
I'm not sure I understand the issue correctly but, isn't that what you would expect? If you select one of the iterations, the ALLSELECTED() in the denominator of your [Percent] measure restricts the [media] measure to only the selected iteration. Therefore [Percent] is 100%, since numerator and denominator yield the same.
What result were you expecting? What would you like to see when selecting only one iteration?
 PrashastiFrequent Visitor
Hi AlB,
I need the percent to remain 0.33 as I'm using this to calculate a measure. I'm then using this measure to get the average with other measures. But When I filter based on iterations, the percent here changes, thereby resulting in a wrong score. I need to know if there's an alternative to AllSelected() or can I create a copy of this table which only has the top 10 values of iterations so that I can use All() on this copy of the table to get the expected result.
Hope this makes the issue clear.
Thanks,
Prashasti
 AnonymousNot applicable
Hi Prashasti,
Actually, current you can use table/matrix visual to 'highlight' interaction with other charts.(it seems like power bi not support to use other visual to highlight table/matrix visuals records)
Regards,
Xiaoxin Sheng
