- Power BI forums
- Updates
- News & Announcements
- Get Help with Power BI
- Desktop
- Service
- Report Server
- Power Query
- Mobile Apps
- Developer
- DAX Commands and Tips
- Custom Visuals Development Discussion
- Health and Life Sciences
- Power BI Spanish forums
- Translated Spanish Desktop
- Power Platform Integration - Better Together!
- Power Platform Integrations (Read-only)
- Power Platform and Dynamics 365 Integrations (Read-only)
- Training and Consulting
- Instructor Led Training
- Dashboard in a Day for Women, by Women
- Galleries
- Community Connections & How-To Videos
- COVID-19 Data Stories Gallery
- Themes Gallery
- Data Stories Gallery
- R Script Showcase
- Webinars and Video Gallery
- Quick Measures Gallery
- 2021 MSBizAppsSummit Gallery
- 2020 MSBizAppsSummit Gallery
- 2019 MSBizAppsSummit Gallery
- Events
- Ideas
- Custom Visuals Ideas
- Issues
- Issues
- Events
- Upcoming Events
- Community Blog
- Power BI Community Blog
- Custom Visuals Community Blog
- Community Support
- Community Accounts & Registration
- Using the Community
- Community Feedback
Register now to learn Fabric in free live sessions led by the best Microsoft experts. From Apr 16 to May 9, in English and Spanish.
- Power BI forums
- Forums
- Get Help with Power BI
- Desktop
- Measure values in rows and columns in Matrix
- Subscribe to RSS Feed
- Mark Topic as New
- Mark Topic as Read
- Float this Topic for Current User
- Bookmark
- Subscribe
- Printer Friendly Page

- Mark as New
- Bookmark
- Subscribe
- Mute
- Subscribe to RSS Feed
- Permalink
- Report Inappropriate Content
Measure values in rows and columns in Matrix
Hello everyone! I have a problem, I'm working with report and need make it like it was in Excell. There are measures like one, two, three, etc, that's rows, and there are mesures like goal, actual and average, that's columns. I made measures, but I have no idea how to do matrix like in Excell, I was wondering if this is possible, Thanks in advance!

Solved! Go to Solution.
- Mark as New
- Bookmark
- Subscribe
- Mute
- Subscribe to RSS Feed
- Permalink
- Report Inappropriate Content
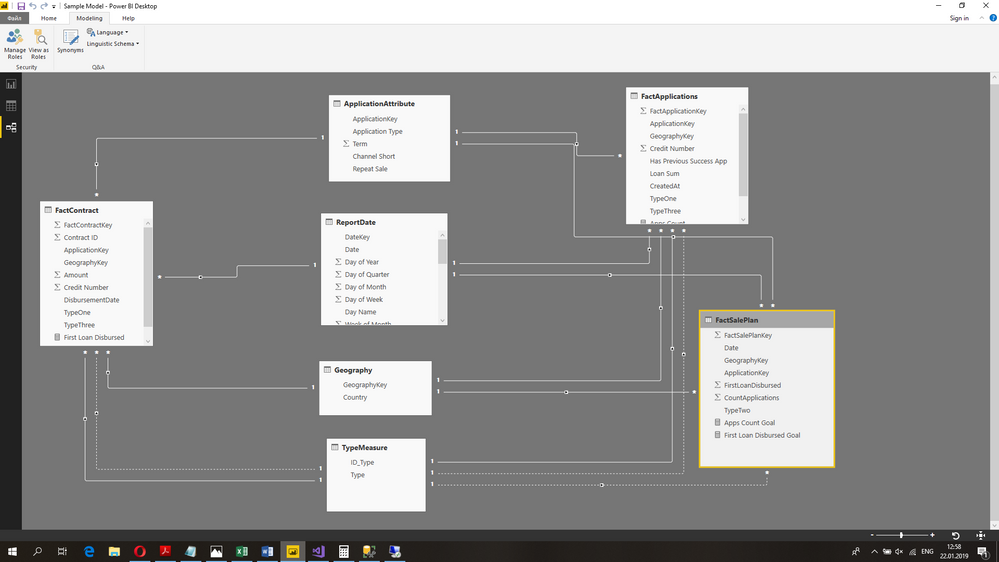
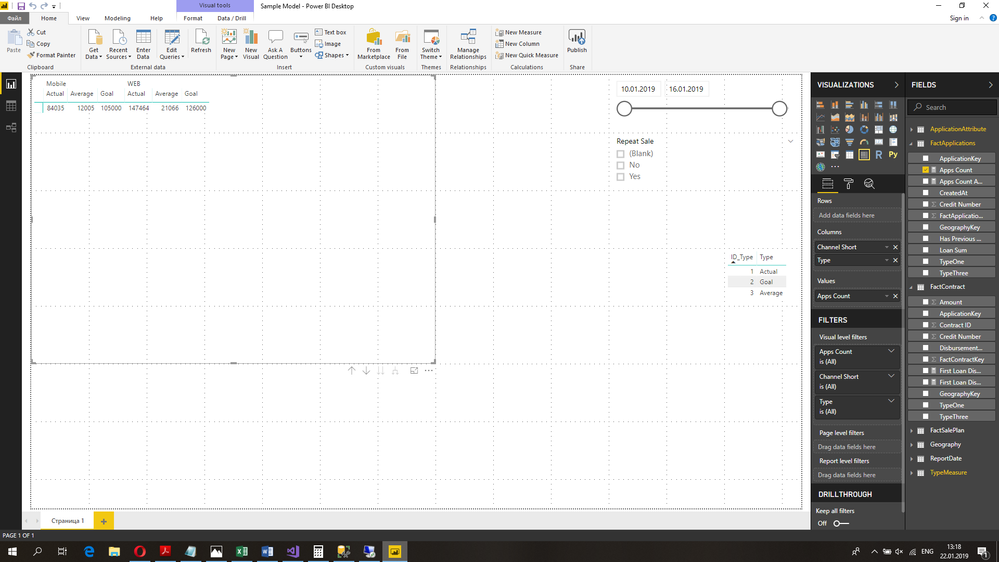
Thank you for answer, but it's not that. I found solution, it's not perfect, but business get what it want. So, I add two columns to FactApplications, Actual (TypeOne) and Average (TypeThree) (both hide of course), in first always 1, in second 3, then i created table TypeMeasure, like that
ID_type - 1,2,3 and Type - Actual, Goal, Average, then I created relationship
then i craeted measure

- Mark as New
- Bookmark
- Subscribe
- Mute
- Subscribe to RSS Feed
- Permalink
- Report Inappropriate Content
@aleksrov In format section of Matrix , if you go to values, Keep "show on rows" on. and search stepped layout ,make that off. I got the solution by doing this. Please check in your case.


- Mark as New
- Bookmark
- Subscribe
- Mute
- Subscribe to RSS Feed
- Permalink
- Report Inappropriate Content
You may take a look at Drill down on column headers and Show values on rows for matrix.
If this post helps, then please consider Accept it as the solution to help the other members find it more quickly.
- Mark as New
- Bookmark
- Subscribe
- Mute
- Subscribe to RSS Feed
- Permalink
- Report Inappropriate Content
Thank you for answer, but it's not that. I found solution, it's not perfect, but business get what it want. So, I add two columns to FactApplications, Actual (TypeOne) and Average (TypeThree) (both hide of course), in first always 1, in second 3, then i created table TypeMeasure, like that
ID_type - 1,2,3 and Type - Actual, Goal, Average, then I created relationship
then i craeted measure


- Mark as New
- Bookmark
- Subscribe
- Mute
- Subscribe to RSS Feed
- Permalink
- Report Inappropriate Content
Any posibility you can supply some sample data? You have what you want it to look like in the end but sample data and your measure calculations/formulas would assist greatly. Please see this post regarding How to Get Your Question Answered Quickly: https://community.powerbi.com/t5/Community-Blog/How-to-Get-Your-Question-Answered-Quickly/ba-p/38490
@ me in replies or I'll lose your thread!!!
Instead of a Kudo, please vote for this idea
Become an expert!: Enterprise DNA
External Tools: MSHGQM
YouTube Channel!: Microsoft Hates Greg
Latest book!: The Definitive Guide to Power Query (M)
DAX is easy, CALCULATE makes DAX hard...
- Mark as New
- Bookmark
- Subscribe
- Mute
- Subscribe to RSS Feed
- Permalink
- Report Inappropriate Content
Sorry, I forgot about one more table, ReportDate.
It has relationship like
ReportDate(DateKey) 1 --> * FactApplications(CreatedAt)
ReportDate(DateKey) 1 --> * FactContrac(DisbursementDate)
ReportDate(DateKey) 1 --> * FactSalePlan(Date)

- Mark as New
- Bookmark
- Subscribe
- Mute
- Subscribe to RSS Feed
- Permalink
- Report Inappropriate Content
Thank you for answer! Yes, I supplied a small piece of data, sorry I didn't do it before. And I forgot to tell, powerbi use live connection to SSAS Tabular 2017. In sample only mains columns and of course that report will be main sale report with more than 30 measures, but the logic the same, in Rows Name of indicator, in columns channel and goal, actual and average of this indicator. In sample data there are three measure Apps Count, Apps Count Goal and Apps Count Avarage and three measure First Loan Count, First Loan Goal and First Loan Avarage, these must be columns with channel above it (like in Excell), and name this indicator in row (Apps Count and First Loan)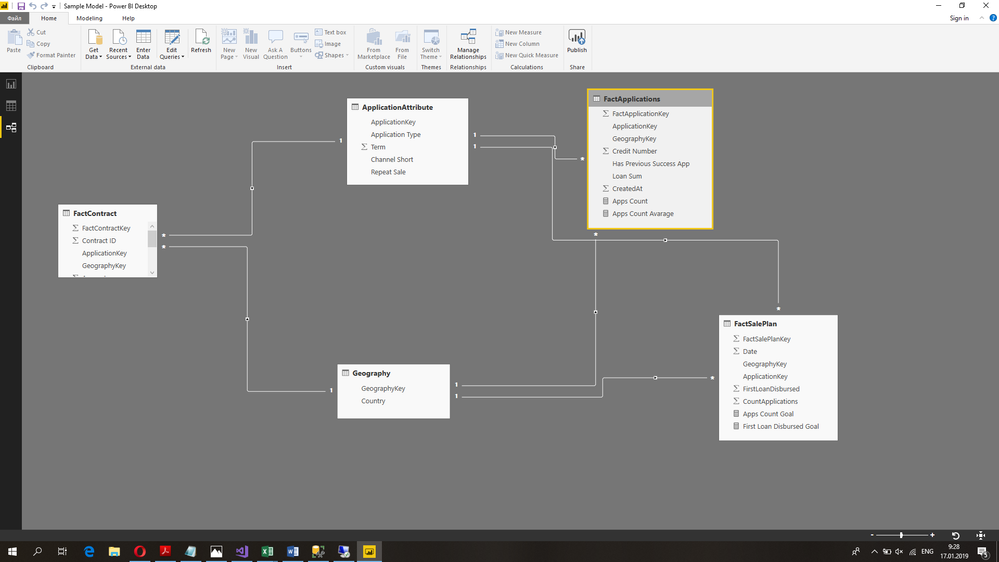
| FactApplicationKey | ApplicationKey | GeographyKey | Credit Number | Has Previous Success App | Loan Sum | CreatedAt |
| 11706453 | 3207 | 2 | 0 | No | NULL | 20190116 |
| 11706454 | 3207 | 2 | 0 | No | NULL | 20190116 |
| 11706455 | 2931 | 2 | 0 | No | NULL | 20190116 |
Fact Contract
| FactContractKey | Contract ID | ApplicationKey | GeographyKey | Amount | Credit Number | DisbursementDate |
| 1099654 | 225263 | 3207 | 2 | 129 | 1 | 20190113 |
| 1100899 | 226508 | 3207 | 2 | 300 | 1 | 20190114 |
| 1101078 | 226687 | 2931 | 2 | 129 | 1 | 20190114 |
ApplicationsAttribute
| ApplicationKey | Application Type | Term | Channel Short | Repeat Sale |
| 3207 | PDL | 30 | WEB | No |
| 2931 | PDL | 30 | Mobile | No |
Geography
| GeographyKey | Country |
| 2 | ID |
FactSalePlan
| FactSalePlanKey | Date | GeographyKey | ApplicationKey | FirstLoanDisbursed | CountApplications |
| 487 | 20190116 | 2 | 3207 | 185 | 1000 |
| 488 | 20190116 | 2 | 2931 | 185 | 1000 |
Measures
- Mark as New
- Bookmark
- Subscribe
- Mute
- Subscribe to RSS Feed
- Permalink
- Report Inappropriate Content
@aleksrov My expected out put is similar to your's in Matrix visual. I can able to do it in row level but unable to display the Growth%. Could you share your solution how did you solve this.

Helpful resources

Microsoft Fabric Learn Together
Covering the world! 9:00-10:30 AM Sydney, 4:00-5:30 PM CET (Paris/Berlin), 7:00-8:30 PM Mexico City

Power BI Monthly Update - April 2024
Check out the April 2024 Power BI update to learn about new features.

Fabric Community Update - April 2024
Find out what's new and trending in the Fabric Community.

| User | Count |
|---|---|
| 97 | |
| 94 | |
| 74 | |
| 71 | |
| 64 |


| User | Count |
|---|---|
| 143 | |
| 109 | |
| 103 | |
| 82 | |
| 74 |


