FabCon is coming to Atlanta
Join us at FabCon Atlanta from March 16 - 20, 2026, for the ultimate Fabric, Power BI, AI and SQL community-led event. Save $200 with code FABCOMM.
Register now!- Power BI forums
- Get Help with Power BI
- Desktop
- Service
- Report Server
- Power Query
- Mobile Apps
- Developer
- DAX Commands and Tips
- Custom Visuals Development Discussion
- Health and Life Sciences
- Power BI Spanish forums
- Translated Spanish Desktop
- Training and Consulting
- Instructor Led Training
- Dashboard in a Day for Women, by Women
- Galleries
- Data Stories Gallery
- Themes Gallery
- Contests Gallery
- QuickViz Gallery
- Quick Measures Gallery
- Visual Calculations Gallery
- Notebook Gallery
- Translytical Task Flow Gallery
- TMDL Gallery
- R Script Showcase
- Webinars and Video Gallery
- Ideas
- Custom Visuals Ideas (read-only)
- Issues
- Issues
- Events
- Upcoming Events
Get Fabric Certified for FREE during Fabric Data Days. Don't miss your chance! Request now
- Power BI forums
- Forums
- Get Help with Power BI
- Desktop
- Matrix with two different tables with no common ke...
- Subscribe to RSS Feed
- Mark Topic as New
- Mark Topic as Read
- Float this Topic for Current User
- Bookmark
- Subscribe
- Printer Friendly Page
- Mark as New
- Bookmark
- Subscribe
- Mute
- Subscribe to RSS Feed
- Permalink
- Report Inappropriate Content
Matrix with two different tables with no common key
Hello everyone,
I want to create a matrix in PowerBI based on two tables that do not have a common key and I am grateful for any help/ideas.
Table 1 looks like this:
As you can see, it contains a specific hirachy.
Table 2 looks like this (excerpt):
As you can see, each category, subcategory and subsubcategory is a column on its own in Table 2.
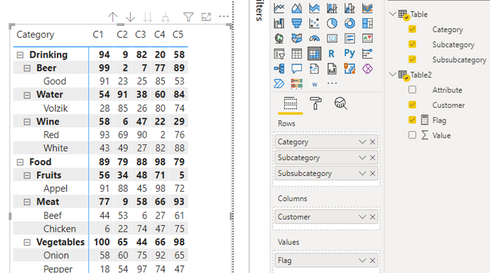
The goal is to have all the categories, subcategories, and sub-subcategories from Table 1 with their respective hirachie as rows in the matrix, the customers (C1, C2, etc.) in the columns, and the values from Table 2 as the values. The result should look something like this:
I have created a PowerBI file with examplary data: PowerBi file
Does anyone have a good idea how this solution can be archived? Any help is welcome. 🙂
Best regards,
Fabi
Solved! Go to Solution.
- Mark as New
- Bookmark
- Subscribe
- Mute
- Subscribe to RSS Feed
- Permalink
- Report Inappropriate Content
Hi @FabiNeed ,
Here are the steps you can follow:
1. Enter the power query, select all columns except [Customer], click Unpivot Columns.
Result:
2. Create measure.
Flag =
IF(
  NOT( ISINSCOPE('Table'[Category])&&ISINSCOPE('Table'[Subcategory])) ,
CALCULATE(SUM('Table2'[Value]),FILTER(ALL(Table2),'Table2'[Customer]=MAX('Table2'[Customer])&&'Table2'[Attribute]=MAX('Table'[Category]))),
IF(
ISINSCOPE('Table'[Category]) &&ISINSCOPE('Table'[Subcategory])&&NOT( ISINSCOPE('Table'[Subsubcategory])),
CALCULATE(SUM('Table2'[Value]),FILTER(ALL(Table2),'Table2'[Customer]=MAX('Table2'[Customer])&&'Table2'[Attribute]=MAX('Table'[Subcategory]))),
IF(
ISINSCOPE('Table'[Category]) &&ISINSCOPE('Table'[Subcategory])&&ISINSCOPE('Table'[Subsubcategory]),
CALCULATE(SUM('Table2'[Value]),FILTER(ALL(Table2),'Table2'[Customer]=MAX('Table2'[Customer])&&'Table2'[Attribute]=MAX('Table'[Subsubcategory])))
  ,0)))
3. Result:
Best Regards,
Liu Yang
If this post helps, then please consider Accept it as the solution to help the other members find it more quickly
- Mark as New
- Bookmark
- Subscribe
- Mute
- Subscribe to RSS Feed
- Permalink
- Report Inappropriate Content
@Anonymous
I implemented your solution and it works like a charme. However, I do not really really understand, how the filter part is working. Could you please describe it to me in words using this example:
FILTER(ALL(Table2),'Table2'[Customer]=MAX('Table2'[Customer])&&'Table2'[Attribute]=MAX('Table'[Category]))),
Especially the parts with the MAX function are interesting to me since I always thought its only possible to compare integer values.
Best,
Fabian
- Mark as New
- Bookmark
- Subscribe
- Mute
- Subscribe to RSS Feed
- Permalink
- Report Inappropriate Content
This is a perfect solution to the problem. Very well explained. Thank you very much!
Helpful resources

Power BI Monthly Update - November 2025
Check out the November 2025 Power BI update to learn about new features.

Fabric Data Days
Advance your Data & AI career with 50 days of live learning, contests, hands-on challenges, study groups & certifications and more!


