Fabric Data Days starts November 4th!
Advance your Data & AI career with 50 days of live learning, dataviz contests, hands-on challenges, study groups & certifications and more!
Get registered- Power BI forums
- Get Help with Power BI
- Desktop
- Service
- Report Server
- Power Query
- Mobile Apps
- Developer
- DAX Commands and Tips
- Custom Visuals Development Discussion
- Health and Life Sciences
- Power BI Spanish forums
- Translated Spanish Desktop
- Training and Consulting
- Instructor Led Training
- Dashboard in a Day for Women, by Women
- Galleries
- Data Stories Gallery
- Themes Gallery
- Contests Gallery
- Quick Measures Gallery
- Visual Calculations Gallery
- Notebook Gallery
- Translytical Task Flow Gallery
- TMDL Gallery
- R Script Showcase
- Webinars and Video Gallery
- Ideas
- Custom Visuals Ideas (read-only)
- Issues
- Issues
- Events
- Upcoming Events
Get Fabric Certified for FREE during Fabric Data Days. Don't miss your chance! Learn more
- Power BI forums
- Forums
- Get Help with Power BI
- Desktop
- Make a result visual count the % that are filtered...
- Subscribe to RSS Feed
- Mark Topic as New
- Mark Topic as Read
- Float this Topic for Current User
- Bookmark
- Subscribe
- Printer Friendly Page
- Mark as New
- Bookmark
- Subscribe
- Mute
- Subscribe to RSS Feed
- Permalink
- Report Inappropriate Content
Make a result visual count the % that are filtered interactively on a visual
Hi there,
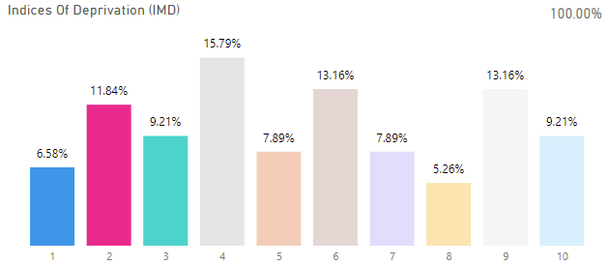
The question might be a bit confusing but it's just a simple enquiry, I have a visual like this below:
This displays a % of a grand total of userid count. And I also have a mini card visual in the top right corner that says a 100% with the exact same column applied too it (with % of grand total)
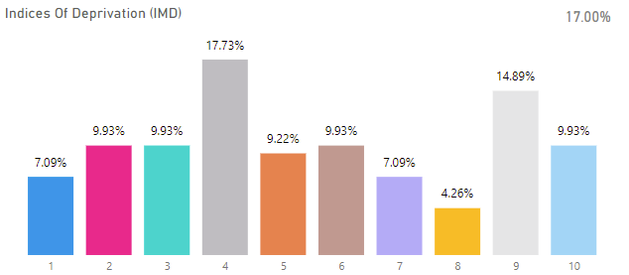
However, I want the top right card visual to show and add up %'s when multiple bars are clicked on the report, such as below:
As you can see, the first 3 bars have been highlighted (clicked on), but the top right % is still 100%, I want it to show the total % highlighted which would be 27.63%. I figured with both visuals sharing the exact same value, it would automatically do this but it isn't.
How would this be possible? And is it possible?
Solved! Go to Solution.
- Mark as New
- Bookmark
- Subscribe
- Mute
- Subscribe to RSS Feed
- Permalink
- Report Inappropriate Content
Hi guys, figured it out. I needed to filter the other category on the visual for it to work, however, blanks were also filtered out so I made sure to filter it with > 1 (categories were numerical)
- Mark as New
- Bookmark
- Subscribe
- Mute
- Subscribe to RSS Feed
- Permalink
- Report Inappropriate Content
Hi,
Share the link from where i can download your PBI file.
Regards,
Ashish Mathur
http://www.ashishmathur.com
https://www.linkedin.com/in/excelenthusiasts/
- Mark as New
- Bookmark
- Subscribe
- Mute
- Subscribe to RSS Feed
- Permalink
- Report Inappropriate Content
Hi @Ashish_Mathur
Thank you but unfortunately the file has too much confidential data and it would take a really long time to make a dummy file. Do you know of how to create a measure that can do this function that I request?
- Mark as New
- Bookmark
- Subscribe
- Mute
- Subscribe to RSS Feed
- Permalink
- Report Inappropriate Content
Hi @Anonymous ,
Is the percentage value a measure?
If so you could create a new measure using SUMX() function and put it in the card visual.
Like:
SUMX(table,[percentage])
Best Regards,
Jay
- Mark as New
- Bookmark
- Subscribe
- Mute
- Subscribe to RSS Feed
- Permalink
- Report Inappropriate Content
Hi @Anonymous
Yes on both visuals the value's are measures, I've tried that very measure you made and it's not working, the %'s aren't the same as the %'s on the graphic.
So if I use this measure
I put in the / 1000 to lose the 0's on the %, but it's still not working properly as shown below:
Do you know why that is?
Helpful resources

Fabric Data Days
Advance your Data & AI career with 50 days of live learning, contests, hands-on challenges, study groups & certifications and more!

Power BI Monthly Update - October 2025
Check out the October 2025 Power BI update to learn about new features.


