Jumpstart your career with the Fabric Career Hub
Find everything you need to get certified on Fabric—skills challenges, live sessions, exam prep, role guidance, and more.
Get started- Power BI forums
- Updates
- News & Announcements
- Get Help with Power BI
- Desktop
- Service
- Report Server
- Power Query
- Mobile Apps
- Developer
- DAX Commands and Tips
- Custom Visuals Development Discussion
- Health and Life Sciences
- Power BI Spanish forums
- Translated Spanish Desktop
- Power Platform Integration - Better Together!
- Power Platform Integrations (Read-only)
- Power Platform and Dynamics 365 Integrations (Read-only)
- Training and Consulting
- Instructor Led Training
- Dashboard in a Day for Women, by Women
- Galleries
- Community Connections & How-To Videos
- COVID-19 Data Stories Gallery
- Themes Gallery
- Data Stories Gallery
- R Script Showcase
- Webinars and Video Gallery
- Quick Measures Gallery
- 2021 MSBizAppsSummit Gallery
- 2020 MSBizAppsSummit Gallery
- 2019 MSBizAppsSummit Gallery
- Events
- Ideas
- Custom Visuals Ideas
- Issues
- Issues
- Events
- Upcoming Events
- Community Blog
- Power BI Community Blog
- Custom Visuals Community Blog
- Community Support
- Community Accounts & Registration
- Using the Community
- Community Feedback
Grow your Fabric skills and prepare for the DP-600 certification exam by completing the latest Microsoft Fabric challenge.
- Power BI forums
- Forums
- Get Help with Power BI
- Desktop
- Level of Detail Equivalent in Power BI
- Subscribe to RSS Feed
- Mark Topic as New
- Mark Topic as Read
- Float this Topic for Current User
- Bookmark
- Subscribe
- Printer Friendly Page
- Mark as New
- Bookmark
- Subscribe
- Mute
- Subscribe to RSS Feed
- Permalink
- Report Inappropriate Content
Level of Detail Equivalent in Power BI
Hi All,
I have a calculation in Tableau I would like to replicate in Power BI. The calculation is fixing the level of detail as follows:
Tableau:
{FIXED [Month], [Restaurant Number], [Employee Role Name],
[Employee Role Type], [Employee Tenure Band]:
MAX([Store Headcount])}
And I am trying to replicate in Power BI as follows:
_StoreHeadcountFixed =
CALCULATE(
    SUM(Sheet1[Store Headcount])
    ,ALLEXCEPT(Sheet1,Sheet1[Month])
    ,All(Sheet1[RestaurantNumber])
    ,allexcept(Sheet1, Sheet1[Employee Role Name])
    ,ALLexcept(Sheet1,Sheet1[Employee Tenure Band])
)
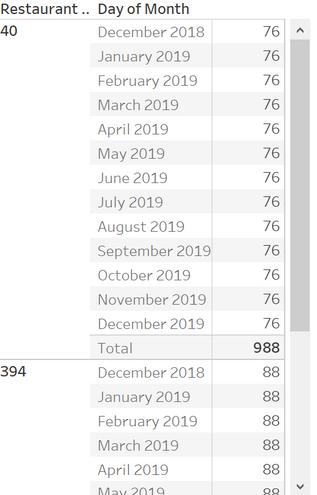
This is what the data looks like blown out:
When looking at the monthly level of granularity I expect my data to look like this (Tableau):
So it is basically summing up Store Head Count for each month.
But instead it looks like this in Power BI:
Any help with this calc would be much appreciated!
- Mark as New
- Bookmark
- Subscribe
- Mute
- Subscribe to RSS Feed
- Permalink
- Report Inappropriate Content
When you see a repeating figure like that it's more than likely a relationship issue. Can you upload the data model or at least a screenshot?
- Mark as New
- Bookmark
- Subscribe
- Mute
- Subscribe to RSS Feed
- Permalink
- Report Inappropriate Content
Helpful resources

Europe’s largest Microsoft Fabric Community Conference
Join the community in Stockholm for expert Microsoft Fabric learning including a very exciting keynote from Arun Ulag, Corporate Vice President, Azure Data.

| User | Count |
|---|---|
| 85 | |
| 84 | |
| 67 | |
| 63 | |
| 62 |
| User | Count |
|---|---|
| 208 | |
| 121 | |
| 112 | |
| 79 | |
| 70 |


