Forum Discussion
Lastdate in directquery mode for more then 1 same dates (same date, different time)
- 9 years ago
Hi mvananaken
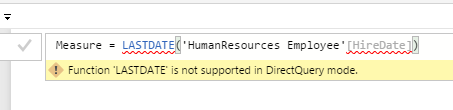
As I tested, the LASTDATE function is not supported in DirectQuery even through I turn on "allow unrestricted measures in Direct Query mode”. My Power BI desktop version is 2.40.4554.463 64-bit (October 2016).SUMMARIZECOLUMNSFunction returns a summary table over a set of groups. You need create a new table when you use SUMMARIZECOLUMNS() function. But the New Table is unable when you connect database using Direct Query. So the function is also not supported.
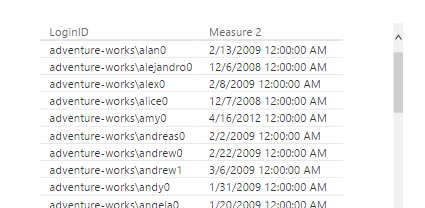
You can try to solve the issue by creating a measure like Last Datavalue = CALCULATE(MAX('GenSens'[Time]), ALLEXCEPT ('GenSens','GenSens'[Temp])), then create a table shown what you want.For example, I create the following measure and table. Select the LoginID and Measure2 as Values level, which displays LoginID based in the lasted HireDate.
Measure 2 = CALCULATE(MAX('HumanResources Employee'[HireDate]),ALLEXCEPT('HumanResources Employee','HumanResources Employee'[LoginID]))Best Regards,
Angelia - 9 years ago
Hi mvananaken,
As descripbed in above solution, I calculate the max date for each LoginID. If you just want to display one column, you can use MAX(Table[datetime]) without filter. It will return the max date of the datetime column rather than LoginID.
If this is not what you want, please share a snapshot for your single "Card" visual or sample date for futher analysis.
Best Regards,
Angelia
Hi mvananaken
As I tested, the LASTDATE function is not supported in DirectQuery even through I turn on "allow unrestricted measures in Direct Query mode”. My Power BI desktop version is 2.40.4554.463 64-bit (October 2016).
SUMMARIZECOLUMNSFunction returns a summary table over a set of groups. You need create a new table when you use SUMMARIZECOLUMNS() function. But the New Table is unable when you connect database using Direct Query. So the function is also not supported.
You can try to solve the issue by creating a measure like Last Datavalue = CALCULATE(MAX('GenSens'[Time]), ALLEXCEPT ('GenSens','GenSens'[Temp])), then create a table shown what you want.
For example, I create the following measure and table. Select the LoginID and Measure2 as Values level, which displays LoginID based in the lasted HireDate.
Measure 2 = CALCULATE(MAX('HumanResources Employee'[HireDate]),ALLEXCEPT('HumanResources Employee','HumanResources Employee'[LoginID]))
Best Regards,
Angelia
- mvananaken9 years ago
Helper II
Hello v-huizhn-msft,
Thanks for reply! This still works in a table with 2 columns, but I tried to show the max value in a single " card" visual. (and then it shows the date only, not the max value).
Kind regards,
Marco
- v-huizhn-msft9 years ago
Microsoft Employee
Hi mvananaken,
As descripbed in above solution, I calculate the max date for each LoginID. If you just want to display one column, you can use MAX(Table[datetime]) without filter. It will return the max date of the datetime column rather than LoginID.
If this is not what you want, please share a snapshot for your single "Card" visual or sample date for futher analysis.
Best Regards,
Angelia