New Offer! Become a Certified Fabric Data Engineer
Check your eligibility for this 50% exam voucher offer and join us for free live learning sessions to get prepared for Exam DP-700.
Get Started- Power BI forums
- Get Help with Power BI
- Desktop
- Service
- Report Server
- Power Query
- Mobile Apps
- Developer
- DAX Commands and Tips
- Custom Visuals Development Discussion
- Health and Life Sciences
- Power BI Spanish forums
- Translated Spanish Desktop
- Training and Consulting
- Instructor Led Training
- Dashboard in a Day for Women, by Women
- Galleries
- Community Connections & How-To Videos
- COVID-19 Data Stories Gallery
- Themes Gallery
- Data Stories Gallery
- R Script Showcase
- Webinars and Video Gallery
- Quick Measures Gallery
- 2021 MSBizAppsSummit Gallery
- 2020 MSBizAppsSummit Gallery
- 2019 MSBizAppsSummit Gallery
- Events
- Ideas
- Custom Visuals Ideas
- Issues
- Issues
- Events
- Upcoming Events
Don't miss out! 2025 Microsoft Fabric Community Conference, March 31 - April 2, Las Vegas, Nevada. Use code MSCUST for a $150 discount. Prices go up February 11th. Register now.
- Power BI forums
- Forums
- Get Help with Power BI
- Desktop
- Joining sales & budget tables via a master date ta...
- Subscribe to RSS Feed
- Mark Topic as New
- Mark Topic as Read
- Float this Topic for Current User
- Bookmark
- Subscribe
- Printer Friendly Page
- Mark as New
- Bookmark
- Subscribe
- Mute
- Subscribe to RSS Feed
- Permalink
- Report Inappropriate Content
Joining sales & budget tables via a master date table
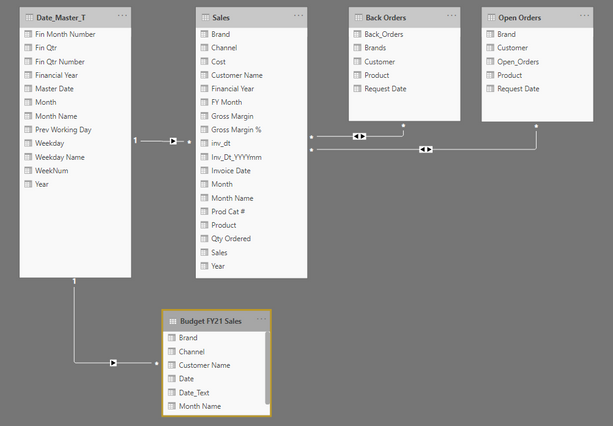
I have the following schema, sales and budget linked via a date master table.
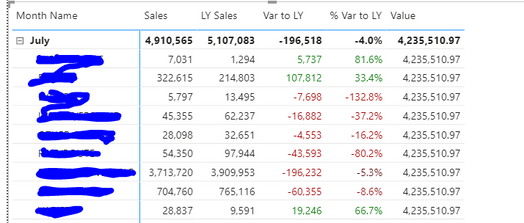
When I try to load the sales budget figures on my matrix in the context of channel, however it just gives the total budget for the month and not the per channel budget:
(the channels are under the blue marker)
I can get the channel sales if I join between sales and budget joined on channel but then I can't use the master date "month" to use the intellisense functions for functions like SAMEPERIODLASTYEAR etc.
Any help would be greatly appreciated
Solved! Go to Solution.
- Mark as New
- Bookmark
- Subscribe
- Mute
- Subscribe to RSS Feed
- Permalink
- Report Inappropriate Content
Hi @Anonymous
Due to I don't know your data model, I build three tables to have a test.
Calendar Table:
Calendar = ADDCOLUMNS(CALENDAR(DATE(2019,1,1),DATE(2020,12,31)) ,"Month",MONTH([Date]))
Add calculated column:
Month Name = CALCULATE(MAX('Month order'[Month Name]),FILTER('Month order','Month order'[Month]=EARLIER('Calendar'[Month])))
Result:
Sales Table:
Budge Table:
And I build relationships between Date columns in three tables.
I think you may use channel column in Sales table to build the matrix, and I get the same issue like yours.
You can build a new Channel table, build relationships between Channel columns in new table and Sales/Budge Table and use channel column in new table to build the matrix:
Channel Table:
Channel = VALUES(Budge[Channel])
Relationships:
Result:
However this way is not recommended, you may build a measure to solve this problem.
Measure_Value =
IF (
    ISINSCOPE ( Sales[Channel] ),
    CALCULATE (
        SUM ( Budge[Value] ),
        FILTER ( Budge, Budge[Channel] = MAX ( Sales[Channel] ) )
    ),
    SUM ( Budge[Value] )
)
Result:
You can download the pbix file from this link: Joining sales & budget tables via a master date table
Best Regards,
Rico Zhou
If this post helps, then please consider Accept it as the solution to help the other members find it more quickly.
- Mark as New
- Bookmark
- Subscribe
- Mute
- Subscribe to RSS Feed
- Permalink
- Report Inappropriate Content
thank you for the solution, I tried joining the tables via another channel table and it works really well so I just did it this way.
I also used the measure solution to solve a further issue I was having with open orders and back orders on another presentation I was building and this works great also, thanks!
- Mark as New
- Bookmark
- Subscribe
- Mute
- Subscribe to RSS Feed
- Permalink
- Report Inappropriate Content
@Anonymous , it has the date you should able to use all time intelligence functions. I can see Date and channel in budget, you should able to analyze data by channel and time and use time intelligence.
Power BI — YTD
https://medium.com/@amitchandak.1978/power-bi-ytd-questions-time-intelligence-1-5-e3174b39f38a
Power BI — QTD
https://medium.com/@amitchandak.1978/power-bi-qtd-questions-time-intelligence-2-5-d842063da839
Power BI — MTD
https://medium.com/@amitchandak.1978/power-bi-mtd-questions-time-intelligence-3-5-64b0b4a4090e
Daily sales - Monthly Target -https://youtu.be/yPQ9UV37LOU
At the Microsoft Analytics Community Conference, global leaders and influential voices are stepping up to share their knowledge and help you master the latest in Microsoft Fabric, Copilot, and Purview. ✨
️ November 12th-14th, 2024
Online Event
Register Here
Helpful resources

Join us at the Microsoft Fabric Community Conference
March 31 - April 2, 2025, in Las Vegas, Nevada. Use code MSCUST for a $150 discount!

Power BI Monthly Update - January 2025
Check out the January 2025 Power BI update to learn about new features in Reporting, Modeling, and Data Connectivity.

| User | Count |
|---|---|
| 124 | |
| 79 | |
| 49 | |
| 38 | |
| 37 |
| User | Count |
|---|---|
| 196 | |
| 80 | |
| 70 | |
| 51 | |
| 42 |


