Join us at the 2025 Microsoft Fabric Community Conference
Microsoft Fabric Community Conference 2025, March 31 - April 2, Las Vegas, Nevada. Use code FABINSIDER for a $400 discount.
Register now- Power BI forums
- Get Help with Power BI
- Desktop
- Service
- Report Server
- Power Query
- Mobile Apps
- Developer
- DAX Commands and Tips
- Custom Visuals Development Discussion
- Health and Life Sciences
- Power BI Spanish forums
- Translated Spanish Desktop
- Training and Consulting
- Instructor Led Training
- Dashboard in a Day for Women, by Women
- Galleries
- Webinars and Video Gallery
- Data Stories Gallery
- Themes Gallery
- Power BI DataViz World Championships Gallery
- Quick Measures Gallery
- R Script Showcase
- COVID-19 Data Stories Gallery
- Community Connections & How-To Videos
- 2021 MSBizAppsSummit Gallery
- 2020 MSBizAppsSummit Gallery
- 2019 MSBizAppsSummit Gallery
- Events
- Ideas
- Custom Visuals Ideas (read-only)
- Issues
- Issues
- Events
- Upcoming Events
The Power BI DataViz World Championships are on! With four chances to enter, you could win a spot in the LIVE Grand Finale in Las Vegas. Show off your skills.
- Power BI forums
- Forums
- Get Help with Power BI
- Desktop
- How to show last n months of data in a column char...
- Subscribe to RSS Feed
- Mark Topic as New
- Mark Topic as Read
- Float this Topic for Current User
- Bookmark
- Subscribe
- Printer Friendly Page
- Mark as New
- Bookmark
- Subscribe
- Mute
- Subscribe to RSS Feed
- Permalink
- Report Inappropriate Content
How to show last n months of data in a column chart just using a calendar date table
Hi. I am trying to show the last n months of a calculated measure I created in a bar chart based on the selected month and year in a slicer. Is there a way to do this with just only the calendar date table?
- Mark as New
- Bookmark
- Subscribe
- Mute
- Subscribe to RSS Feed
- Permalink
- Report Inappropriate Content
Hi,
You may refer to my solution here - Flex a Pivot Table to show data for x months ended a certain user defined month.
Hope this helps.
Regards,
Ashish Mathur
http://www.ashishmathur.com
https://www.linkedin.com/in/excelenthusiasts/
- Mark as New
- Bookmark
- Subscribe
- Mute
- Subscribe to RSS Feed
- Permalink
- Report Inappropriate Content
Hi @Sagejah9 ,
I created some data:
Here are the steps you can follow:
1. Create calculated column.
DateColumn =
DATE(YEAR('Table'[date]),MONTH('Table'[date]),1)
2. Create calculated table.
Table 2 =
DISTINCT('Table'[DateColumn])
3. Change the date format in Column tools.
4. Create measure.
Flag =
var _select=SELECTEDVALUE('Table 2'[DateColumn])
return
IF(
MAX('Table'[date])>=DATE(YEAR(_select),1,1)&&MAX('Table'[date])<=EOMONTH(_select,0),1,0)
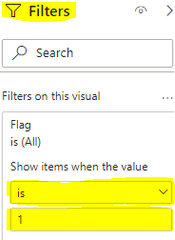
5. Use the column [DateColumn] of Table2 as the slicer, place the measure in Filters and set is=1, apply filter.
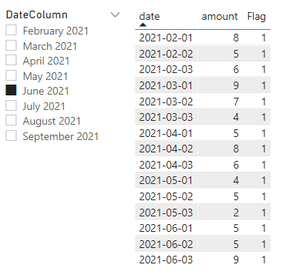
6. Result:
When 2021.6 is selected, the data before June of the current year is displayed
Best Regards,
Liu Yang
If this post helps, then please consider Accept it as the solution to help the other members find it more quickly
- Mark as New
- Bookmark
- Subscribe
- Mute
- Subscribe to RSS Feed
- Permalink
- Report Inappropriate Content
This is really cool. But how can it work with Date Hirarchies slicer?
- Mark as New
- Bookmark
- Subscribe
- Mute
- Subscribe to RSS Feed
- Permalink
- Report Inappropriate Content
I would like to show the last n months in this chart. I had to turn off the interaction from the slicer to show all the values. When I try to do the measure to show the last n months, the values show correct from oct to Jan and when Feb is selected the values from oct to Jan change to the same value as Feb.
- Mark as New
- Bookmark
- Subscribe
- Mute
- Subscribe to RSS Feed
- Permalink
- Report Inappropriate Content
@Sagejah9 Is your Calendar table the basis for both the slicers and the axis of the measure? Because I don't believe it will work that way, you would need separate, disconnected tables.
Follow on LinkedIn
@ me in replies or I'll lose your thread!!!
Instead of a Kudo, please vote for this idea
Become an expert!: Enterprise DNA
External Tools: MSHGQM
YouTube Channel!: Microsoft Hates Greg
Latest book!: Power BI Cookbook Third Edition (Color)
DAX is easy, CALCULATE makes DAX hard...
- Mark as New
- Bookmark
- Subscribe
- Mute
- Subscribe to RSS Feed
- Permalink
- Report Inappropriate Content
hi @Greg_Deckler yes, it would be. But seeing that it cannot work. I created a duplicate of my calendar table and used that on the basis of the axis and the condition passed. And the original calendar for the filters. I did a lookup for the month number of the month slicer and returned all months less than or equal to the selected month's number. I'm not sure if there is a more effective way to do this.
- Mark as New
- Bookmark
- Subscribe
- Mute
- Subscribe to RSS Feed
- Permalink
- Report Inappropriate Content
@Sagejah9 I don't know what code you used but essentially that's how I would have done it.
Follow on LinkedIn
@ me in replies or I'll lose your thread!!!
Instead of a Kudo, please vote for this idea
Become an expert!: Enterprise DNA
External Tools: MSHGQM
YouTube Channel!: Microsoft Hates Greg
Latest book!: Power BI Cookbook Third Edition (Color)
DAX is easy, CALCULATE makes DAX hard...
- Mark as New
- Bookmark
- Subscribe
- Mute
- Subscribe to RSS Feed
- Permalink
- Report Inappropriate Content

Its repeating the value for March for all the months
- Mark as New
- Bookmark
- Subscribe
- Mute
- Subscribe to RSS Feed
- Permalink
- Report Inappropriate Content
@Sagejah9 Try:
SalesMargin (last 5 months) =
VAR __MaxDate = MAX( 'DimDate'[Date])
VAR __MinDate = EDATE ( __MaxDate,-5 )
var salesmargin =
CALCULATE (
[SalesMargin%],
FILTER (
ALL ( DimDate2[Date]),
DimDate2[Date] <= __MaxDate )
&& DimDate2[Date] >= __MinDate)
Follow on LinkedIn
@ me in replies or I'll lose your thread!!!
Instead of a Kudo, please vote for this idea
Become an expert!: Enterprise DNA
External Tools: MSHGQM
YouTube Channel!: Microsoft Hates Greg
Latest book!: Power BI Cookbook Third Edition (Color)
DAX is easy, CALCULATE makes DAX hard...
- Mark as New
- Bookmark
- Subscribe
- Mute
- Subscribe to RSS Feed
- Permalink
- Report Inappropriate Content
I tried it. The datapoint is repeated for all months in the visual and changes when I selected a different month.
- Mark as New
- Bookmark
- Subscribe
- Mute
- Subscribe to RSS Feed
- Permalink
- Report Inappropriate Content
@Sagejah9 Do you have a relationship defined between DimDate and your fact table?
Follow on LinkedIn
@ me in replies or I'll lose your thread!!!
Instead of a Kudo, please vote for this idea
Become an expert!: Enterprise DNA
External Tools: MSHGQM
YouTube Channel!: Microsoft Hates Greg
Latest book!: Power BI Cookbook Third Edition (Color)
DAX is easy, CALCULATE makes DAX hard...
Helpful resources

Join us at the Microsoft Fabric Community Conference
March 31 - April 2, 2025, in Las Vegas, Nevada. Use code MSCUST for a $150 discount!

Power BI Monthly Update - February 2025
Check out the February 2025 Power BI update to learn about new features.

| User | Count |
|---|---|
| 85 | |
| 74 | |
| 63 | |
| 39 | |
| 38 |


