FabCon is coming to Atlanta
Join us at FabCon Atlanta from March 16 - 20, 2026, for the ultimate Fabric, Power BI, AI and SQL community-led event. Save $200 with code FABCOMM.
Register now!- Power BI forums
- Get Help with Power BI
- Desktop
- Service
- Report Server
- Power Query
- Mobile Apps
- Developer
- DAX Commands and Tips
- Custom Visuals Development Discussion
- Health and Life Sciences
- Power BI Spanish forums
- Translated Spanish Desktop
- Training and Consulting
- Instructor Led Training
- Dashboard in a Day for Women, by Women
- Galleries
- Data Stories Gallery
- Themes Gallery
- Contests Gallery
- QuickViz Gallery
- Quick Measures Gallery
- Visual Calculations Gallery
- Notebook Gallery
- Translytical Task Flow Gallery
- TMDL Gallery
- R Script Showcase
- Webinars and Video Gallery
- Ideas
- Custom Visuals Ideas (read-only)
- Issues
- Issues
- Events
- Upcoming Events
The Power BI Data Visualization World Championships is back! Get ahead of the game and start preparing now! Learn more
- Power BI forums
- Forums
- Get Help with Power BI
- Desktop
- How to show all dates although data does not exist...
- Subscribe to RSS Feed
- Mark Topic as New
- Mark Topic as Read
- Float this Topic for Current User
- Bookmark
- Subscribe
- Printer Friendly Page
- Mark as New
- Bookmark
- Subscribe
- Mute
- Subscribe to RSS Feed
- Permalink
- Report Inappropriate Content
How to show all dates although data does not exist taking into account a range of dates?
I eneryone!
This report is formed by 3 tables (date1 (dimension table of date 1), fact_table and date2 (an independent dimension table of dates)).
So that it is shown a table with the last 20 days once selected an specific date on date slicer, the fields of time on slicers are those in date2 and the field of date in table 2 is from date1. In this way as the following example.
If I select 20 April, 2023, and I do click in any company on table1 (for example first row in green ruta1 company A), appears automatically last 20 days for this route and company in table2 with the amount calculated in the following way:
Some companies have amount every day and therefore we can see all LAST 20 dates, but the problem is when others companies have data one day yes and one day no, as this example. For this reason, although last 20 days are from 1 to 20 of April, just show dates with data. I would like to have something like this, although data does not exist:
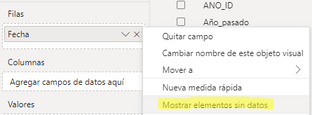
I got to see all dates clicking here ("show elements without data":
, but the problem is that all dates existing on dimension table DATE1 appears... from 01/01/2021 to 31/12/2023...
I would like just to see last 20 dates, not all dates...
Please, could you help me with it.
Thank you so much for all your support.
Thank you!
- Mark as New
- Bookmark
- Subscribe
- Mute
- Subscribe to RSS Feed
- Permalink
- Report Inappropriate Content
Hi everyone!
To get this functionality, I had to create a view with a cross join of the table having available all dates for each route and company and make a coalesce, if the value exists then value, else 0. The problem now is the performance, but it is a question of trying to improve the query to make it more efficient.
Thank you all for your support.
- Mark as New
- Bookmark
- Subscribe
- Mute
- Subscribe to RSS Feed
- Permalink
- Report Inappropriate Content
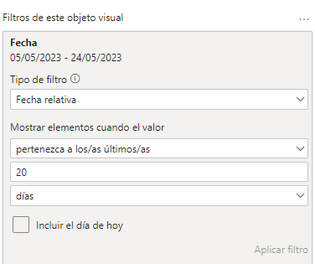
You can put a visual level filter to have your visual only display the last 20 days.
- Mark as New
- Bookmark
- Subscribe
- Mute
- Subscribe to RSS Feed
- Permalink
- Report Inappropriate Content
Hi Syk,
it does not work. When I make this filter on this table 2, anything is shown because it takes last days until today, As I have filtered 20 April on slicers, when I apply this filter, table2 is empty.
I have tried to limit this table creating another table with a range of dates between max value of date (in this case would be 20 April) and min date (in this case 20 April -20 ) but it does not work neither...
Thank you for your help
Helpful resources

Power BI Dataviz World Championships
The Power BI Data Visualization World Championships is back! Get ahead of the game and start preparing now!

| User | Count |
|---|---|
| 39 | |
| 38 | |
| 38 | |
| 28 | |
| 27 |
| User | Count |
|---|---|
| 124 | |
| 88 | |
| 73 | |
| 66 | |
| 65 |


