Forum Discussion

 Advocate II
How to map latitude longitude
 Anonymous11 years ago
sjkp,
This one is a little counter intuitive. The only map tool that can take straight lat/long is Power Map in Excel, but there currently isn't any integration with the rest of the BI stack yet for that.
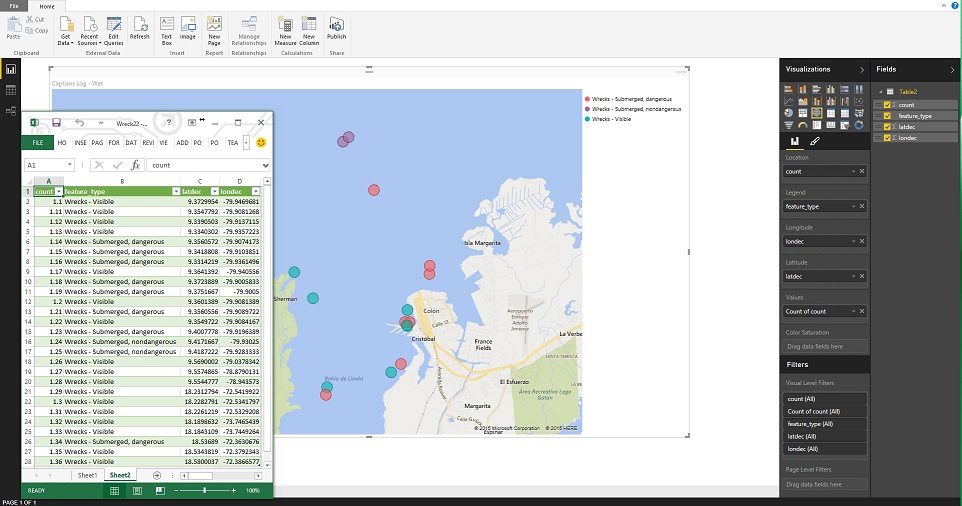
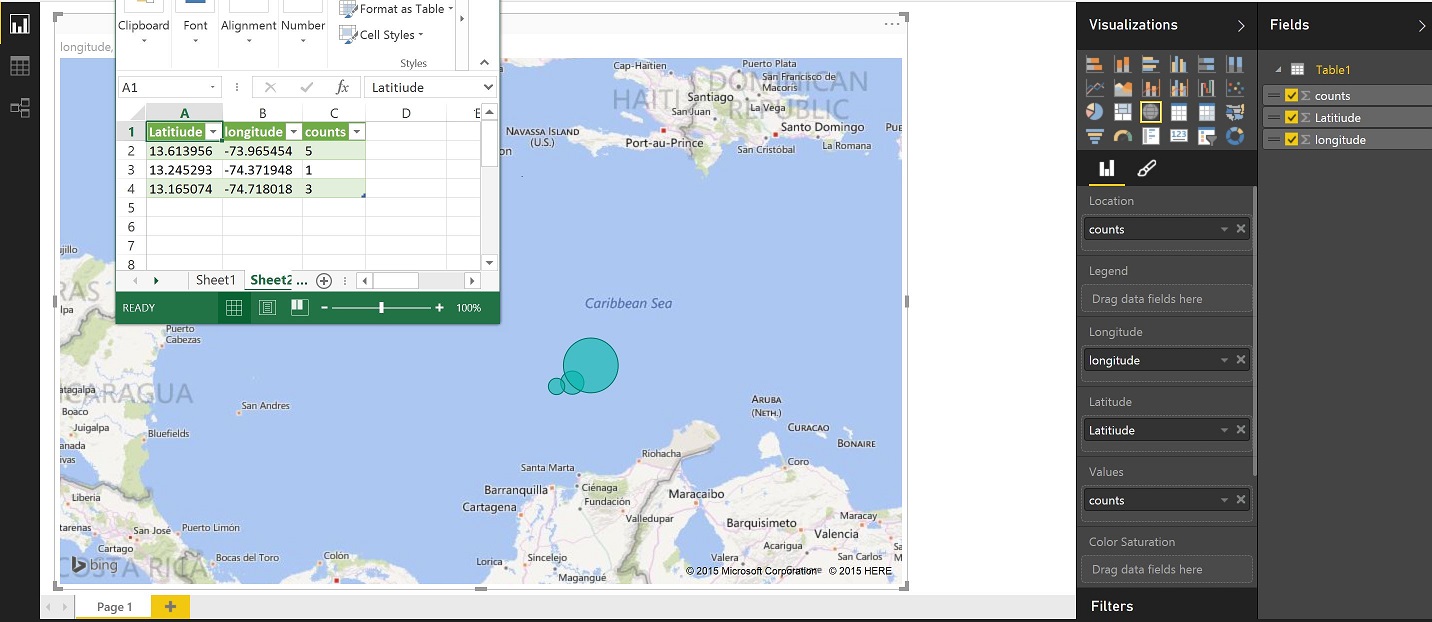
The way you do this in Power View - maps, or the PBI Desktop is put you lat and long in the appropriate Fields, then whatever it is you are examining in that location (count of wrecks, count of "x") that goes in the location and the value fields. Then your bubbles will show up in the middle of the ocean at the coordinates you specified in the lat/long.
If there aren't direct counts, I would assume you can just create a column to contain the value of 1 to make this work.
Here is a screenshot of the sample data I pulled in and the layout in PBI Desktop
 Advocate II
Thanks Eno, I was looking for a solution that works in power bi deskop and preferably powerbi.com (online) or whatever the name for it is. I am aware that it works in power map, but that is not really the tool I want to suggest customers to use going forward.
I hope it's a bug or just a missing feature that it currently is so unintuitive to use. But I will try out your suggestion.
Advocate IIOkay that is pretty **bleep**ed up. If I use a value of 1 for the location, then it will not work, the location value has to be unique. Because if it's not then it will sum all the lat/long together with the same location, which will obviously not give anything meaning full.
- Anonymous11 years agoNot applicable
sjkp,
Looked into this a little more, as I wanted to get this to work.
If you look at the below snapshot, I've created decimals as numbers to (in theory) reduce the bubble size so they all look the same. Then, when I set up the map, I selected the field "Count" in the value section and chose "Count(distinct)"
I'd throw in a "Boom goes the dynamite" here out of excitement if I thought this solved it completely, but I think it's just a hack that works. As a word of caution, I started messing around with calculated columns to try to randomly generate the decimals in PBI Desktop, and when I did so, the bubbles increased in size... Though, I definetely think it's an option in your original data set prior to pulling it in. In any case, give a whirl with your dataset and let me know if it works for you. (I also made sure that it published to the site correctly, and it did.)
(edit to ping sjkp)
 Joeyslaptop7 years agoFrequent Visitor
You can choose "Average", and it will cluster the latitude and longitude to a central location dependent of the grouping of your dataset. So, if you group by city, it would average the Lat and Long to the center of all of the adresses within that city, and then would show the bubble size as the number of adresses clustered into that location.