Forum Discussion

 Advocate II
How to map latitude longitude
 Anonymous11 years ago
sjkp,
This one is a little counter intuitive. The only map tool that can take straight lat/long is Power Map in Excel, but there currently isn't any integration with the rest of the BI stack yet for that.
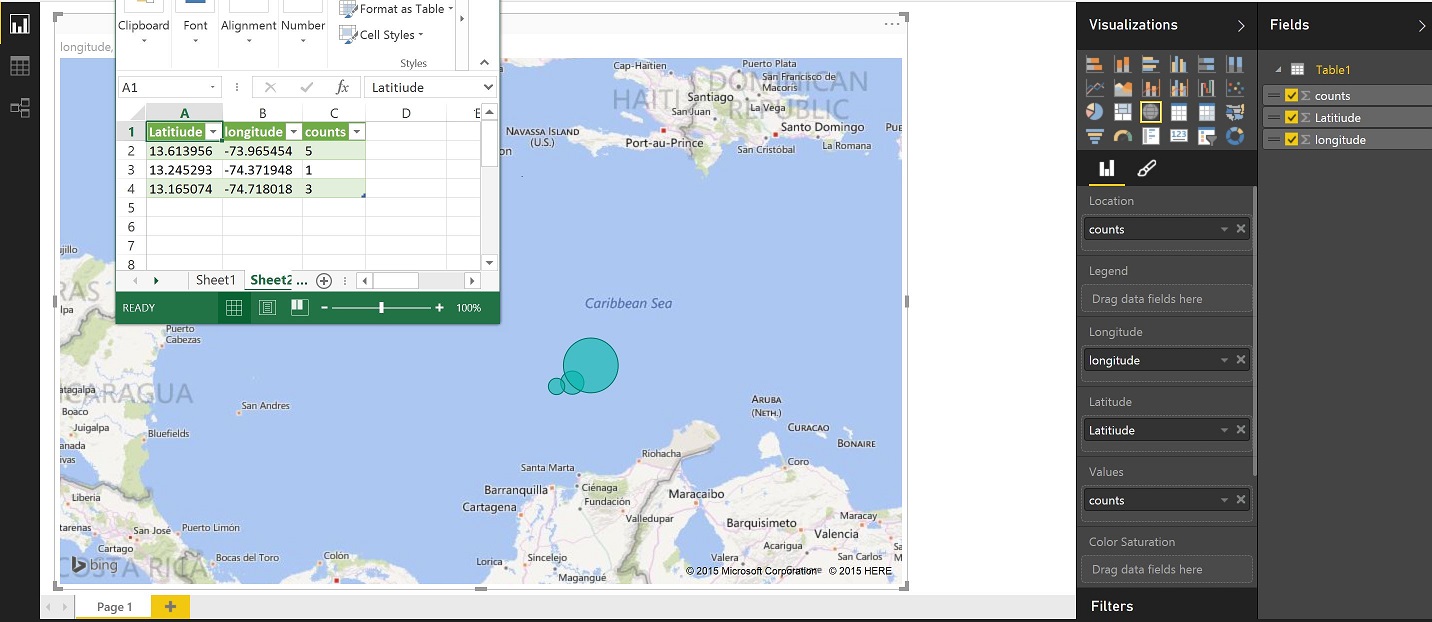
The way you do this in Power View - maps, or the PBI Desktop is put you lat and long in the appropriate Fields, then whatever it is you are examining in that location (count of wrecks, count of "x") that goes in the location and the value fields. Then your bubbles will show up in the middle of the ocean at the coordinates you specified in the lat/long.
If there aren't direct counts, I would assume you can just create a column to contain the value of 1 to make this work.
Here is a screenshot of the sample data I pulled in and the layout in PBI Desktop

 Community Champion
Can you provide an example of the format you are using for latitude and longitude? Should be like:
Text,Latitude,Longitude
Thing1,-37.8136,144.9631
That is Melbourne Australia
In your data model, click on the column for Latitude and set the "Data category" to "Latitude". Do the same for Longitude. This is on the Modeling tab.
The way this is *supposed* to work is that in the map visualization you put your text identifier as the Location, you put your Longitude and Latitude into their appropriate fields and voila, you have your map. This works perfectly in Excel Power View. Note in Excel, the data cateogorization and on the "Advanced" tab.
Not so much in Power BI Desktop, it wants to put "Count of Longitude" and "Count of Latitude" into the Longitude and Latitude fields even though I have them categorized correctly. I'd say it's a bug personally. Interestingly, in the "Location" field suggestions it says that it can either be named location or latitude and longitude coordinates, but it doesn't allow you to drag two fields in that and I haven't found a combination of longitude and latitude that I can drag into that field to make it do anything useful.